)
Derived Data Products
The GAGE GNSS Analysis Center (AC) at Central Washington University and the GAGE GNSS Analysis Center Coordinator (ACC) at MIT analyze RINEX (Level 1) data to generate post-processed derived data (Level 2) products for more than 2,000 stations from NOTA, NSF PI networks, and other regional networks. Please see Recent and planned changes to GAGE GNSS data analysis centers and products, including the discontinuation of the NMT AC and PBO products. Key reference: Reviews of Geophysics Publication on PBO GPS Data Analysis Methods and Products (Herring et al., 2016)
Quick Links to GPS/GNSS Data Products
Includes: Overview, Direct File Access, Search and Access Tools.
Overview
| GPS/GNSS Derived Data Products | Access Method / Product Format | |||||
|---|---|---|---|---|---|---|
| Data Product Level | Description | Generation Frequency | Creator | File Server | Web Graphical Interface | Web Service |
| Level 2 | Position solution time series | Daily | MIT | ASCII, CSV | n/a (was DAIv2) | ASCII, CSV |
| Velocity solutions | Monthly | MIT | ASCII | n/a (was DAIv2) | ASCII, CSV | |
| Position offsets (e.g. coseismic) | Varies | MIT | ASCII | n/a | n/a | |
| Tropospheric parameter estimates | Daily | CWU | ASCII | n/a | n/a | |
| Position solution QA parameters | Daily, varies | UNR | ASCII | n/a (was DAIv2) | n/a | |
| Position solutions (loose) | Daily | CWU | SINEX | n/a (was DAIv2) | n/a | |
| Position solutions (constrained) | Daily | MIT | SINEX | n/a (was DAIv2) | n/a |
Direct File Access
File Server
- GAGE’s primary direct data access point. Subdirectories contain time series, velocities, offsets, earthquake event files, hydrologic loading displacements, etc.
- GPS Site Coordinates
List of site coordinates for all active stations via ASCII File processed by the GAGE AC’s and ACC for the most recent epoch (full 24 hour day) available. List is generated dynamically via web services and is continuously updated. Available in IGS14, NAM14, ANT14, IGS08, and NAM08 reference frames. - GPS Site Velocities
Long term GPS velocity field solutions via ASCII File. Estimates of offsets from antenna changes, equipment problems (such as broken radomes), and earthquakes are incorporated. Solutions are from the most recent “snapshot” velocity solution, generated approximately monthly. Available in IGS14, NAM14, ANT14, IGS08, and NAM08 reference frames.
- GPS Site Coordinates
GPS/GNSS Time Series Plots
- Link to position time series plots.
PBO H2O Products
- An archive of PBO H2O snow depth, soil moisture, and vegetation data products using GPS reflections were posted every morning. This archive for historic purposes until a new way to generate these products is found.
Search and Access Tools
 Collapse All
 Expand All
-
Graphical User Interfaces
- GPS/GNSS Time Series Interactive Plotter (Beta)
Plots north-south, east-west, and vertical GPS positions over time, for one or more stations on a single plot, and provides site event information such as equipment changes. After launching the viewer, enter one or more GPS site 4-char ID(s) in the white field in the upper left. - GPS Velocities via KMZ
Long term GPS velocity field solutions for the PBO network. Estimates of offsets from antenna changes, equipment problems (such as broken radomes), and earthquakes are incorporated. NOTE: Best used with Google Earth Pro desktop. - GPS Time Series via Network Monitoring Station Pages (GAGE Operated Stations Only)
NOTE: intended for station status only. Some data and products are linked from these station pages but this is NOT a primary data access point as only a subset of existing stations/data are available from this interface. The primary data access points for GAGE data are the DAIv2 and the File Server. See also: Nearby timeseries plots.
- GPS/GNSS Time Series Interactive Plotter (Beta)
-
Web Services/Command Line Interfaces
- GPS Time Series via Web Services
Retrieves the daily position time series for the station identified by four character id, reference frame, and date range. - GPS Velocities via Web Services
Retrieves the daily velocity time series for the station identified by four character id, reference frame, and date range.
- GPS Time Series via Web Services
Analysis Information and Resources
Includes: GAGE Velocity Field, Technical Reports, Processing Files, User Notices and Advisories, Documentation, Resources, Presentations and Posters, External Data Centers.
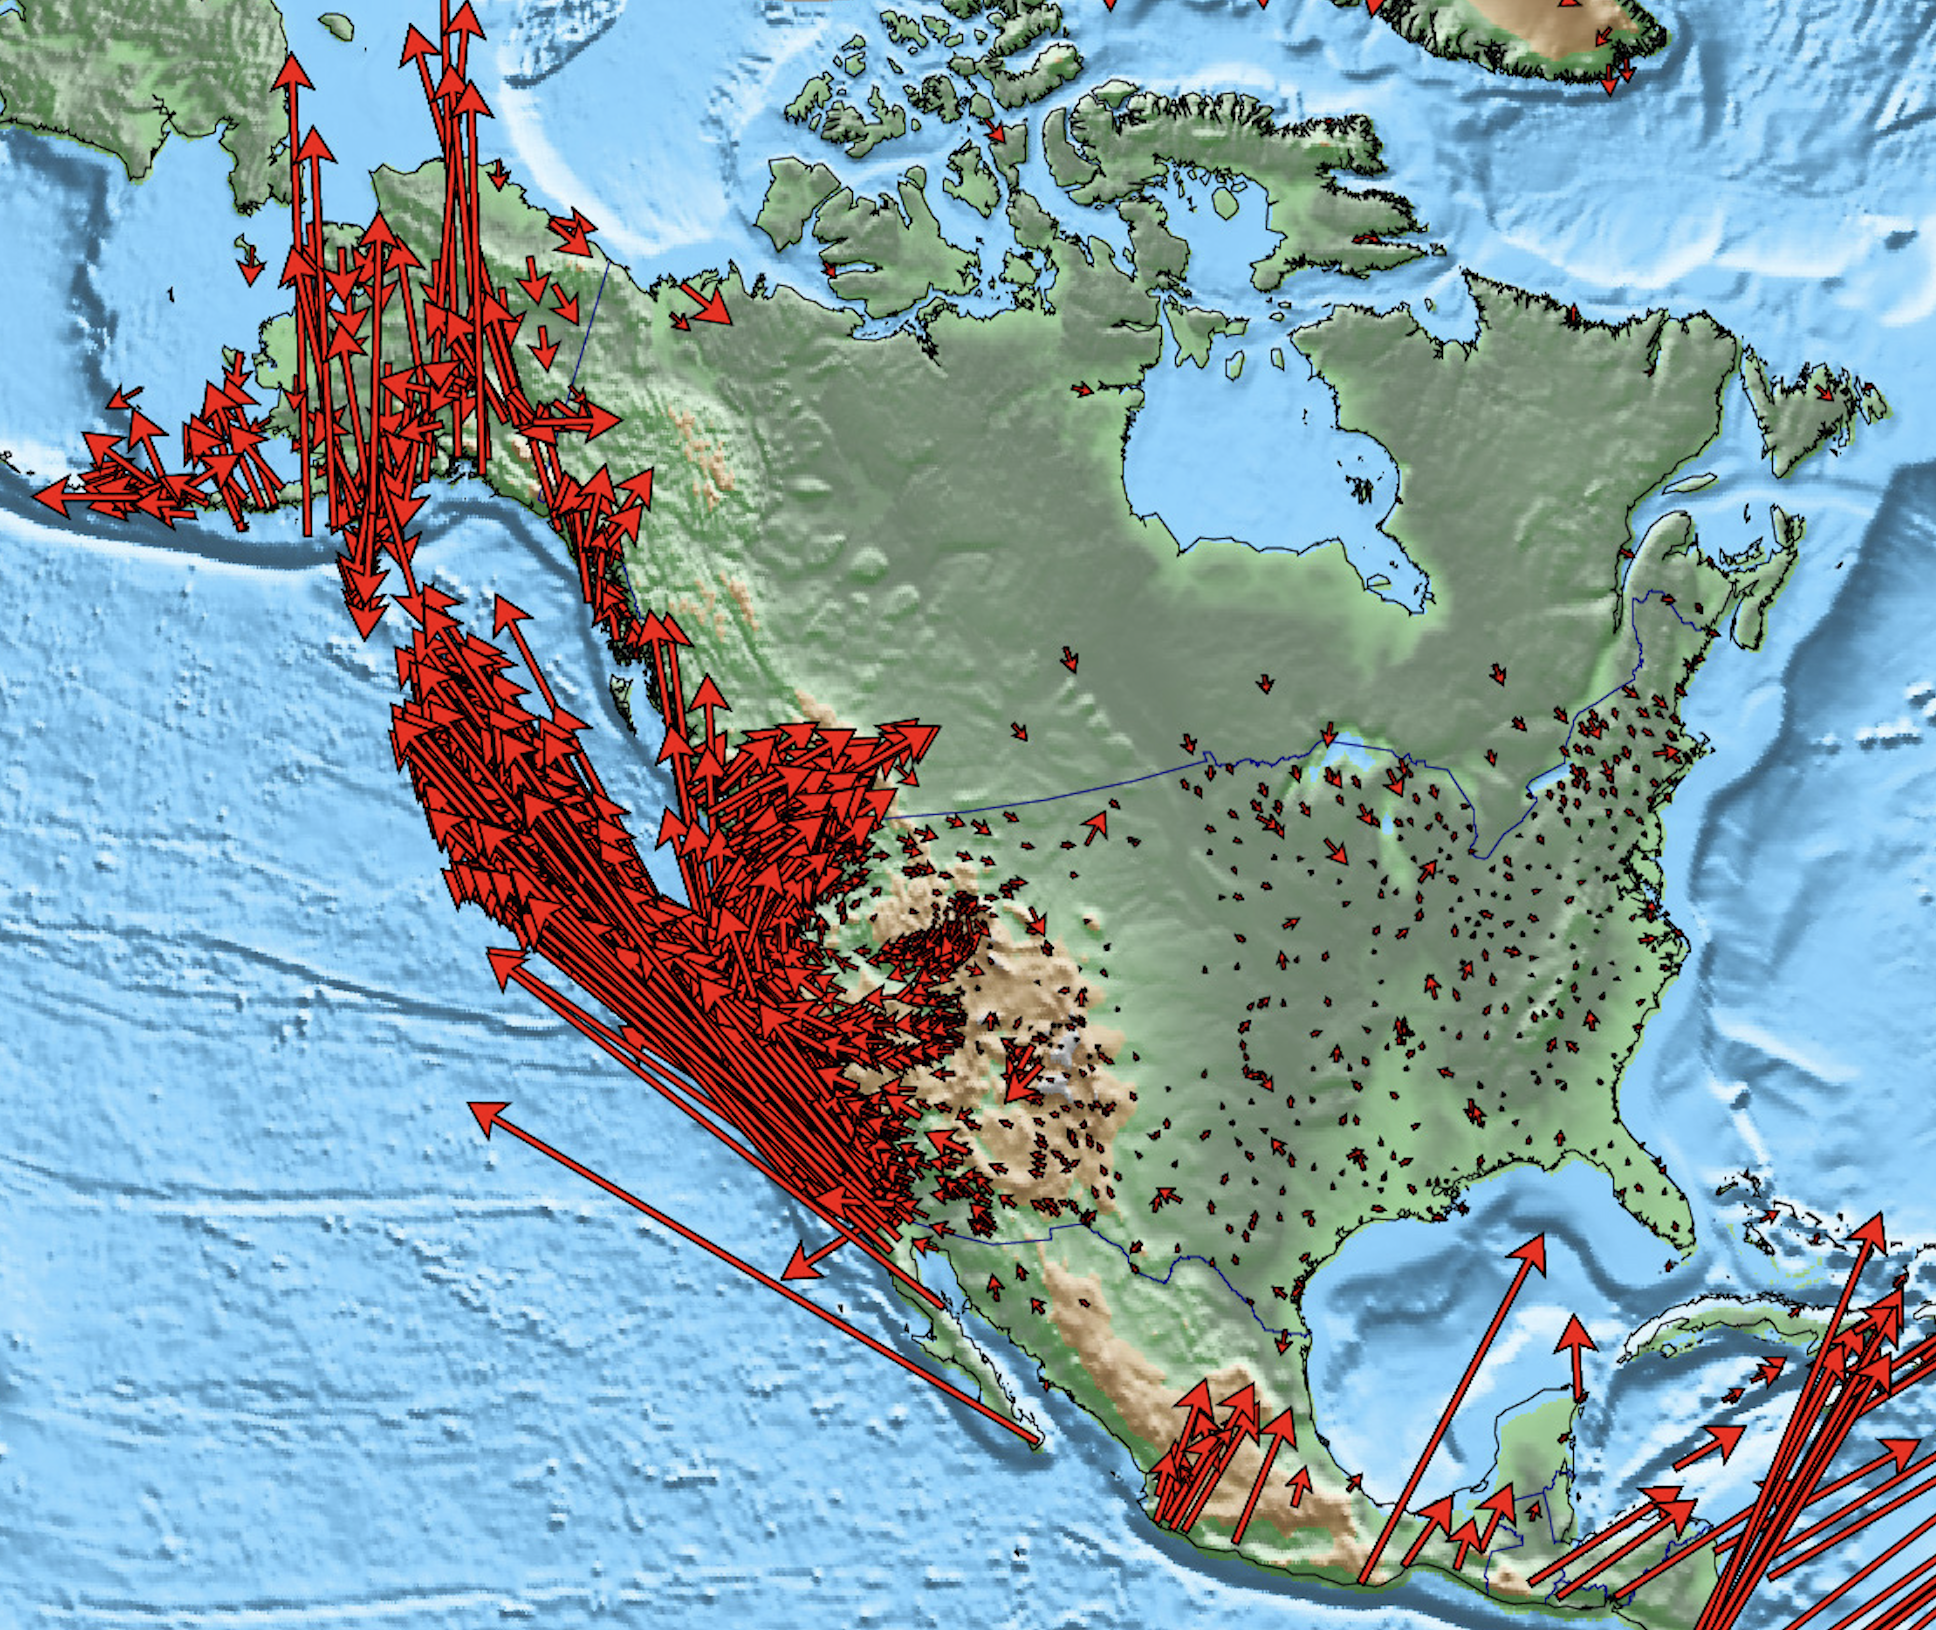
GAGE Velocity Field
- GAGE 2025 GNSS Velocity Fields Release Notes
- GAGE 2025 GNSS Velocity Fields, Ancillary files and Comparison products
- GAGE 2024 GNSS Velocity Fields Release Notes
- GAGE 2024 GNSS Velocity Fields, Ancillary files and Comparison products
- GAGE 2023 GNSS Velocity Fields Release Notes
- GAGE 2023 GNSS Velocity Fields, Ancillary files and Comparison products
- GAGE 2021 GNSS Velocity Fields Release Notes
- GAGE 2021 GNSS Velocity Fields, Ancillary files and Comparison products
- GAGE 2020 GNSS Velocity Fields Release Notes
- GAGE 2019 GNSS Velocity Field Release Notes
- GAGE 2019 GNSS Velocity Fields, Ancillary files and Comparison products
- GAGE 2017 GPS Velocity Field Release Notes
- GAGE 2016 GPS Velocity Field Release Notes
- GAGE 2015 GPS Velocity Field Release Notes
Technical Reports
Quarterly technical reports describing GAGE GPS analysis activities are provided by the Analysis Center Coordinator at MIT. These reports summarize statistics for all stations analyzed during the period as well as processing notes, station offsets, etc.
-
2025
-
2024
-
2023
-
2022
-
2021
-
2020
-
2019
-
2018
-
2017
-
2016
-
2015
-
2014
Processing Files
The following files include all the files referred to in the Quarterly Technical Reports.
- FY2024-Q4 MIT ACC Ancillary Files
- FY2024-Q3 MIT ACC Ancillary Files
- FY2024-Q2 MIT ACC Ancillary Files
- FY2021-Q2 MIT ACC Ancillary Files
- FY2021-Q1 MIT ACC Ancillary Files
- FY2020-Q4 MIT ACC Ancillary Files
- FY2020-Q3 MIT ACC Ancillary Files
- FY2020-Q2 MIT ACC Ancillary Files
- Central Washington University (CWU) AC Processing files
- New Mexico Tech (NMT) AC Processing files
- MIT ACC Processing Files
User Notices and Advisories
- Notice to Users October 6 2020, Re-scaling of the Standard Deviation in GNSS Position Time Series
- Notice to Users 2015-04-23 (CSV File Format Update) [pdf], [html]
- Notice to Users 2014-11-03 (Data Quality Issues) [pdf]
- Notice to Users 2013-03-25 (File Format Updates) [pdf]
Documentation
- GAGE NAM14 Transition [pdf]
- GAGE Facility GNSS Data Analysis and Products Update [pdf]
- UNAVCO/GAGE Analysis Transition to IGS14 System [pdf]
- GPS Data Analysis Plan: GAGE [pdf]
- Reviews of Geophysics Publication on PBO GPS Data Analysis Methods and Products (Herring et al., 2016) [pdf]
- Treatment of Scale in GAGE and by Other GPS Data Processing Groups [pdf]
- Digital Object Identifiers for GAGE Derived Products
Resources
Presentations and Posters
- 2023 SAGE/GAGE Workshop Poster by Herring et al.: GAGE GNSS Products [pdf]
- 2019 AGU Poster by Puskas et al.: Evaluating Anubis Software for GNSS Data Quality Control in the GAGE Facility [pdf]
- 2019 SAGE/GAGE Workshop Poster by Puskas et al.: Introduction to Anubis Software for GNSS Quality Control in the GAGE Facility and NOTA [pdf]
- 2019 SAGE/GAGE Workshop Poster by Enloe et al.: Facility GNSS Data Archives and Products [pdf]
- 2017 Fall AGU Poster by Phillips et al.: Decadal GPS Time Series and Velocity Fields Spanning the North American Continent and Beyond: New Data Products, Cyberinfrastructure and Case Studies from the EarthScope Plate Boundary Observatory (PBO) and Other Regional Networks [pdf]
- 2014 Fall AGU Poster by Herring et al.: GPS data analysis and results from the GAGE project [pdf]
External Data Centers
Currently, data from most GNSS stations analyzed by the GAGE AC and ACC are accessed from the GAGE Data Center. Data from additional stations are accessed from the following data centers:
- NOAA National Geodetic Survey (NGS) ftp://cors.ngs.noaa.gov/cors/rinex
- NASA Crustal Dynamics Data Information System (CDDIS) https://cddis.nasa.gov/archive/gps/data
- Scripps Orbit and Permanent Array Center (SOPAC) ftp://garner.ucsd.edu/pub/rinex / http://garner.ucsd.edu/pub/rinex
- Northern California Earthquake Data Center (NCEDC) ftp://www.ncedc.org/pub/gps/rinex / https://www.ncedc.org/gps/rinex
- Pacific Northwest Geodetic Array (PANGA) ftp://ftp.panga.cwu.edu/pub/data / https://www.panga.cwu.edu/data_ftp_pub/data/
- Western Canada Deformation Array (WCDA) ftp://wcda.pgc.nrcan.gc.ca/pub/gpsdata/rinex
- EUREF Permanent GNSS Network ftp://igs.bkg.bund.de/EUREF/obs / https://igs.bkg.bund.de/root_ftp/
- University California, Berkeley ftp://quake.geo.berkeley.edu/pub/gps/rinex
Last modified: 2026-05-28 09:22:21 America/Denver