)
PBO H2O Data Portal: Documentation | Derived Data Products
This page here for archival purposes.
Contents
- Overview
- Downloads
- Snow Depth Product
- Snow Water Equivalent
- Soil Moisture Product
- Vegetation Product
- Loading Product
- Ancillary Data
- Product Release Versions
- Citation and Acknowledgments
Overview
The Global Positioning System continuously transmits L-band signals (wavelengths of 19 and 24.4 cm) to support real-time navigation users. These same signals are being tracked by networks of high-precision GPS instruments that were installed by geophysicists and geodesists to measure plate tectonics. These networks exist at both the global and regional scale and data are freely available. One of the error sources for geodetic and geophysical users of GPS data is reflected signals. The GPS Reflections Research Group used the reflected signals captured by these GPS networks to measure environmental parameters, including near-surface soil moisture, snow cover, and vegetation. For most sites the footprint of the method is ~20 meter in radius, which complements small-scale in situ sensors and large-scale satellite methods.
Updated snow depth, soil moisture, and vegetation data products using GPS reflections are posted every morning. The full period of record is available for download in a csv format. Efforts have been made to ensure that the products available through the PBO H2O Data Portal are of high quality, but inconsistencies and erroneous data may pass through our analysis system without being identified.
We focused on data from the NSF EarthScope Plate Boundary Observatory. This facility was operated by UNAVCO, Inc. The PBO network was comprised of 1100 GPS receivers; nearly all located in the western United States. Raw GPS RINEX files, metadata, and positioning products are available from the GAGE archive.
-The GPS Reflections Research Group Kristine M. Larson and Eric E. Small October 27, 2015
Further reading:
- Overview of PBO H2O and GPS-IR, Larson, 2016
GPS interferometric reflectometry: applications to surface soil moisture, snow depth, and vegetation water content in the western United States. https://doi.org/doi:10.1002/wat2.1167
[local copy] - Roesler, C. & Larson, K.M. (2018), Software tools for GNSS interferometric reflectometry (GNSS-IR). GPS Solut (2018) 22: 80. https://doi.org/10.1007/s10291-018-0744-8 [local copy] Roesler_2018-GPSS-S-18-00063.pdf
Downloads
Water cycle products were updated every day from 2006 to 2017. A CSV file was created for each site that includes all products (snow, smc, veg). These files include latitude, longitude, and ellipsoidal height. The files are called 4-CHAR-STATION-CODE_v1.csv, e.g., av38_v1.csv.
UNAVCO File Server - https://gage-data.earthscope.org/archive/gnss/products/ucb_h2o/by_site/.
Snow Depth Product
Snow depth is estimated through a calculation of the relative change of the effective multipath reflector height with respect to a snow free surface. Our ability to measure the location of the reflecting surface has a precision of a few cm.
Snow depth was reported with a time resolution of one day. This snow depth value is the average of all available satellite tracks. The uncertainty reported represents a rms scatter of those satellite tracks. Given that snow depth does vary azimuthally (and thus will be different for different satellite tracks), some of the error reported for daily snow depth represents true variability rather than measurement error. We can provide snow depth values for individual satellite tracks to interested researchers. Poor precision may also indicate that snow fell that day. If there is only a single satellite retrieval at a site, the error has been set to 5 cm.
You can download all snow results, look at individual stations, or use the dynamic snow map capability. We have compiled and animated results from past snow years. These gifs are available here.
We use the L2C GPS SNR data to estimate snow depth. At our request, UNAVCO turned on L2C tracking at a few sites in fall 2009 and 2010. The greater PBO network only became L2C-enabled in July, 2011. For this reason, the number of sites reporting snow depth increased dramatically from less than 10 in 2010 to nearly 100 in 2012. Please refer to Larson et al. (2009) and Larson and Nievinski (2013) for further details about the methodologies to estimate snow depth from GPS data.
Further reading:
- First Demonstration, Larson et al. 2009 Can we measure snow depth with GPS receivers? https://doi.org/10.1029/2009GL039430 [local copy]
- Description of Product, Larson and Nievinski, 2013 GPS snow sensing: results from the EarthScope Plate Boundary Observatory https://doi.org/10.1007/s10291-012-0259-7 [local copy]
- Validation of Product, McCreight et al., 2014 Snow depth, density, and SWE estimates derived from GPS reflection data: Validation in the western U. S. https://doi.org/10.1002/2014WR015561 [local copy]
Snow Water Equivalent
We provide Snow Water Equivalent (SWE) estimates with error for all GPS sites. For most sites SWE estimates are modeled on (1) the time series of daily snow depth observations, and (2) snow depth and density observations taken from nearby (within 70 km) SNOTEL stations. The snow density model used to convert these required data to SWE estimates is described in McCreight and Small (2014). The model estimates daily density which is multiplied by observed depth to give daily SWE.
The SWE errors are a (vector sum) combination of the depth and density errors (though they are not truly independent), as described by McCreight et al. (2014). The density errors (not provided) are a function of day of year at each GPS site. Density errors are estimated using a process of leave-one-out cross validation, also described by McCreight et al. (2014). Essentially, when more than one SNOTEL location is used to model density at a GPS, each of these SNOTEL are in-turn treated as if it were the GPS antenna and its density estimated using the remaining SNOTEL sites. The modeled density errors (modeled-observed) are then gathered from all these individually-left-out SNOTEL sites by day of year and their standard deviation on each day is used to describe the uncertainty in the corresponding density model estimate at the GPS antenna. When only one SNOTEL is available for estimating density at a GPS antenna it is not possible to estimate the errors in this way and no error is provided.
If there are no nearby SNOTEL sites, the model from the Sturm paper is used: Sturm, M., B. Taras, G. E. Liston, C. Derksen, T. Jonas, and J. Lea (2010), Estimating Snow Water Equivalent Using Snow Depth Data and Climate Classes, J. Hydrometeorol., 11(6), 1380–1394, https://doi.org/10.1175/2010JHM1202.1.
Further reading:
- McCreight, J. L. and Small, E. E.: Modeling bulk density and snow water equivalent using daily snow depth observations, The Cryosphere, 8, 521-536, https://doi.org/10.5194/tc-8-521-2014, 2014. [local copy]
Soil Moisture Product
The ground reflected multipath at a given site modulates the Signal-to-Noise Ratio (SNR) observations according to the following simple relationship:
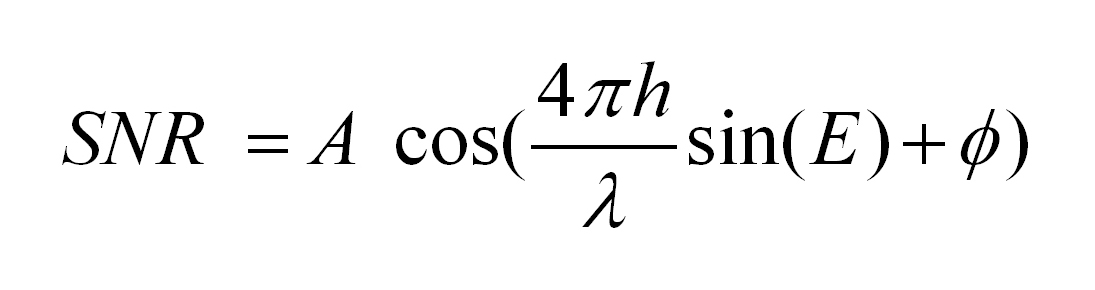
Where A is the multipath amplitude, h is the height of the antenna phase center above the ground, lambda is the GPS wavelength, E is the satellite elevation angle, and phi is a phase offset.
Near surface soil moisture is reported as volumetric soil moisture (VSM). In release 1.0, soil moisture values are based on fluctuations in phi, where VSM = VSM_min + 0.0148*phi. The minimum soil moisture value (VSM_min) is determined for each site based on the residual moisture content in the STATSGO dataset. The linear relationship is based on forward modeling done in Chew et al. (2014).
Each daily VSM value is based on the average for 8 or more satellite tracks. GPS data contaminated by snow have been removed. We are currently working on:
- A vegetation model to improve soil moisture retrievals.
- Definition of the standard error for the daily retrieval.
- Validation of the GPS technique by comparison with other soil moisture sensors.
We use the L2C signal for soil moisture studies. For this reason (see discussion above in the snow section), few results are available before June 2011. Further details regarding the retrieval of soil moisture content from GPS data, and its comparison to in-situ samples of volumetric water content can be found in Larson et al. (2008) and Larson et al. (2010).
We are collaborating with the SMAP validation team.
Release 2.0 of the soil moisture product was made on 2014 April 1. This version includes ~50 more stations and uses a vegetation model. Release 2.5 included more than 130 sites, and uses the vegetation model described by Chew et al. (2015). On October 28, 2015, we improved the data leveling algorithm.
Further reading:
- First Demonstration of Product, Larson et al., 2008 Use of GPS receivers as a soil moisture network for water cycle studies https://doi.org/10.1029/2008GL036013 [local copy]
- Description of Product, Chew et al., 2016 An algorithm for soil moisture estimation using GPS-interferometric reflectometry for bare and vegetated soil https://doi.org/10.1007/s10291-015-0462-4 [local copy]
- Validation of Product, Small et al., 2016 Validation of GPS-IR Soil Moisture Retrievals: Comparison of Different Algorithms to Remove Vegetation Effects https://doi.org/10.1109/JSTARS.2015.2504527 [local copy]
Vegetation Product
Changes in vegetation are quantified through changes in the GPS engineering metric mp1rms (Estey and Meertens, 1999). This metric is computed on a daily basis. It represents an average scattering statistic for all GPS satellites, not just those transmitting the L2C frequency. For this reason we are able to present results for most sites starting on January 1, 2007. Data have been evaluated for contamination by snow and rain; a quality flag is provided to indicate when our vegetation products should be used. As our algorithms for detecting these effects improve, we will release new vegetation products.
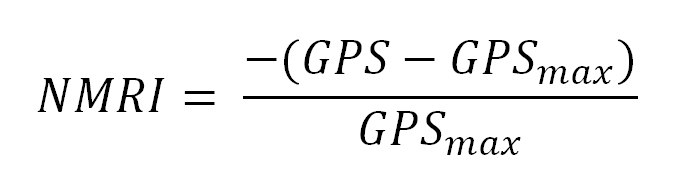
We have normalized the mp1rms GPS engineering data, and provide this in the column designated NMRI (Normalized Microwave Reflection Index). Defining the raw mp1rms data as GPS, and the mean value of data in top 5th percentile as GPSmax
For an overview of the release 1.0 and 2.0 GPS NMRI vegetation index, see Larson and Small (2014).. Release 3.0 of the vegetation index, including ~200 more stations, should be available in summer 2014.
Further reading:
- First demo, Small et al 2010 ()
- Description of Product, Larson and Small 2014 ()
- Validation of Product, Small et al 2014 ()
Loading Product
Water loading for the GPS stations (Li and vanDam, 2015) is determined by convolving Greens functions with surface mass from the North American Land Data Assimilation System (NLDAS). The NLDAS snow water equivalent and soil moisture are provided at monthly periods with spatial sampling every 0.25 degree of latitude and longitude. Snow and soil moisture is masked out in ice-covered regions. See also information provided at UCAR.
This water loading product will be updated twice per year. The north, east, and vertical load time series begin in 2000 and ends in early 2014. Plots of the vertical loads and detrended position time series from the Nevada Geodetic Laboratory are provided on the portal. However, the position data themselves must be downloaded from Nevada Reno.
Ancillary Data
Approximately 100 PBO sites have Vaisala WXT520 Sensors. These instruments are maintained by UNAVCO, and the data are archived at UNAVCO. We have computed maximum, minimum, and daily average temperatures, and daily precipitation and provide these with our water cycle products when they are available. However, we cannot vouch for the accuracy of these data. Questions about the accuracy of these data should be sent to UNAVCO.
We have downloaded hourly NLDAS modeled data for temperature and precipitation (0.125 degree, NLDAS-2 data for North America (NLDAS_FORA0125_H.002) from the Goddard Earth Science Data and Information Services Center (GES DISC)) for each of our sites. We have computed daily values (maximum, minimum, and average temperature, and precipitation) for each of these quantities. We currently update the NLDAS files daily with a 8 day lag. Please refer to the North American Land Data Assimilation System Phase 2 (NLDAS-2) Products README Document for further information.
We have downloaded NDVI (MOD13 16-day 250m MODIS) and GPP (1km, MODIS, 8 day) products for each PBO site. They have been minimally edited, i.e. negative NDVI values have been set to zero and some snow clearing has been done. These data are available in the csv archive file along with our water cycle products.
For each station website, we have provided a digital elevation model (raw DEM data available upon request), NLDAS cumulative precipitation plot, a google maps link, a photograph, and a link to the official PBO website for this station hosted by UNAVCO.
Product Release Versions
Product Version 1.0
- Snow Depth (meters)
- NMRI (normalized)
- Volumetric Soil Moisture Percentage, 100*cm3 cm-3
Product Version 1.1
- Snow Depth and Snow Water Equivalent (meters)
- NMRI (normalized)
- Volumetric Soil Moisture (cm3 cm-3)
- GLDAS Water Loading
Product Version 2.0
- Snow Depth and Snow Water Equivalent (m)
- NMRI (normalized)
- Volumetric Soil Moisture (cm3 cm-3) with vegetation corrections.
- GLDAS Water Loading
Product Version 2.5
- New retrieval algorithm for volumetric soil moisture.
- Bias (2cm) removed from snow depth retrievals.
- No change to vegetation products.
- Oct 28, 2015, updated soil moisture leveling code.
Last modified: 2026-05-28 09:22:21 America/Denver