
All materials are made freely available under a Creative Commons CC BY 4.0 license. Please credit EarthScope Consortium.
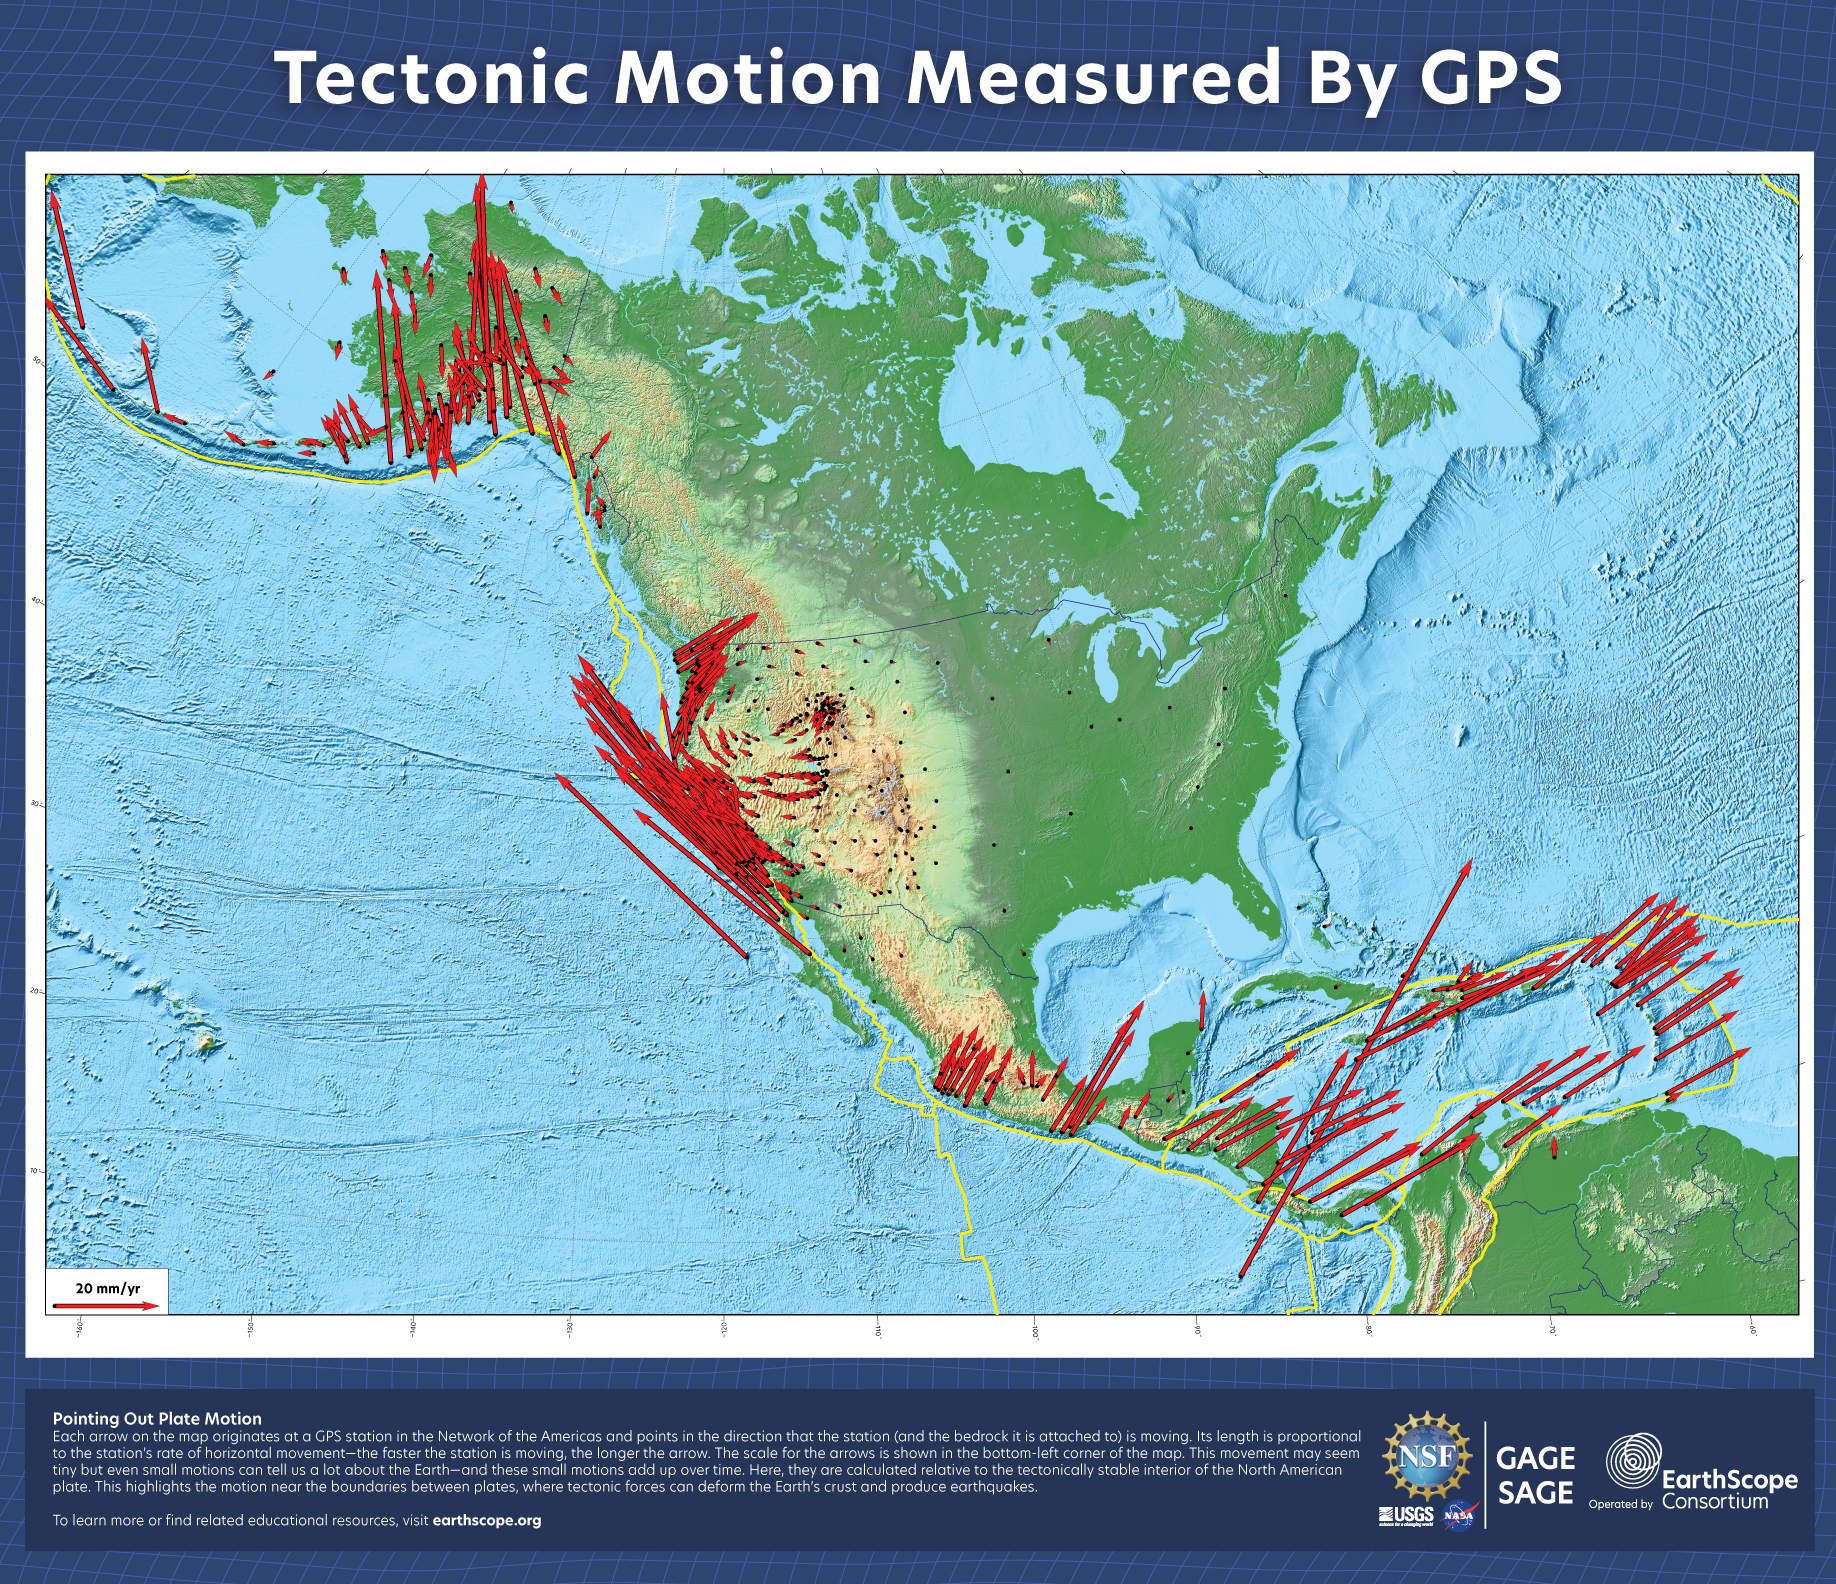
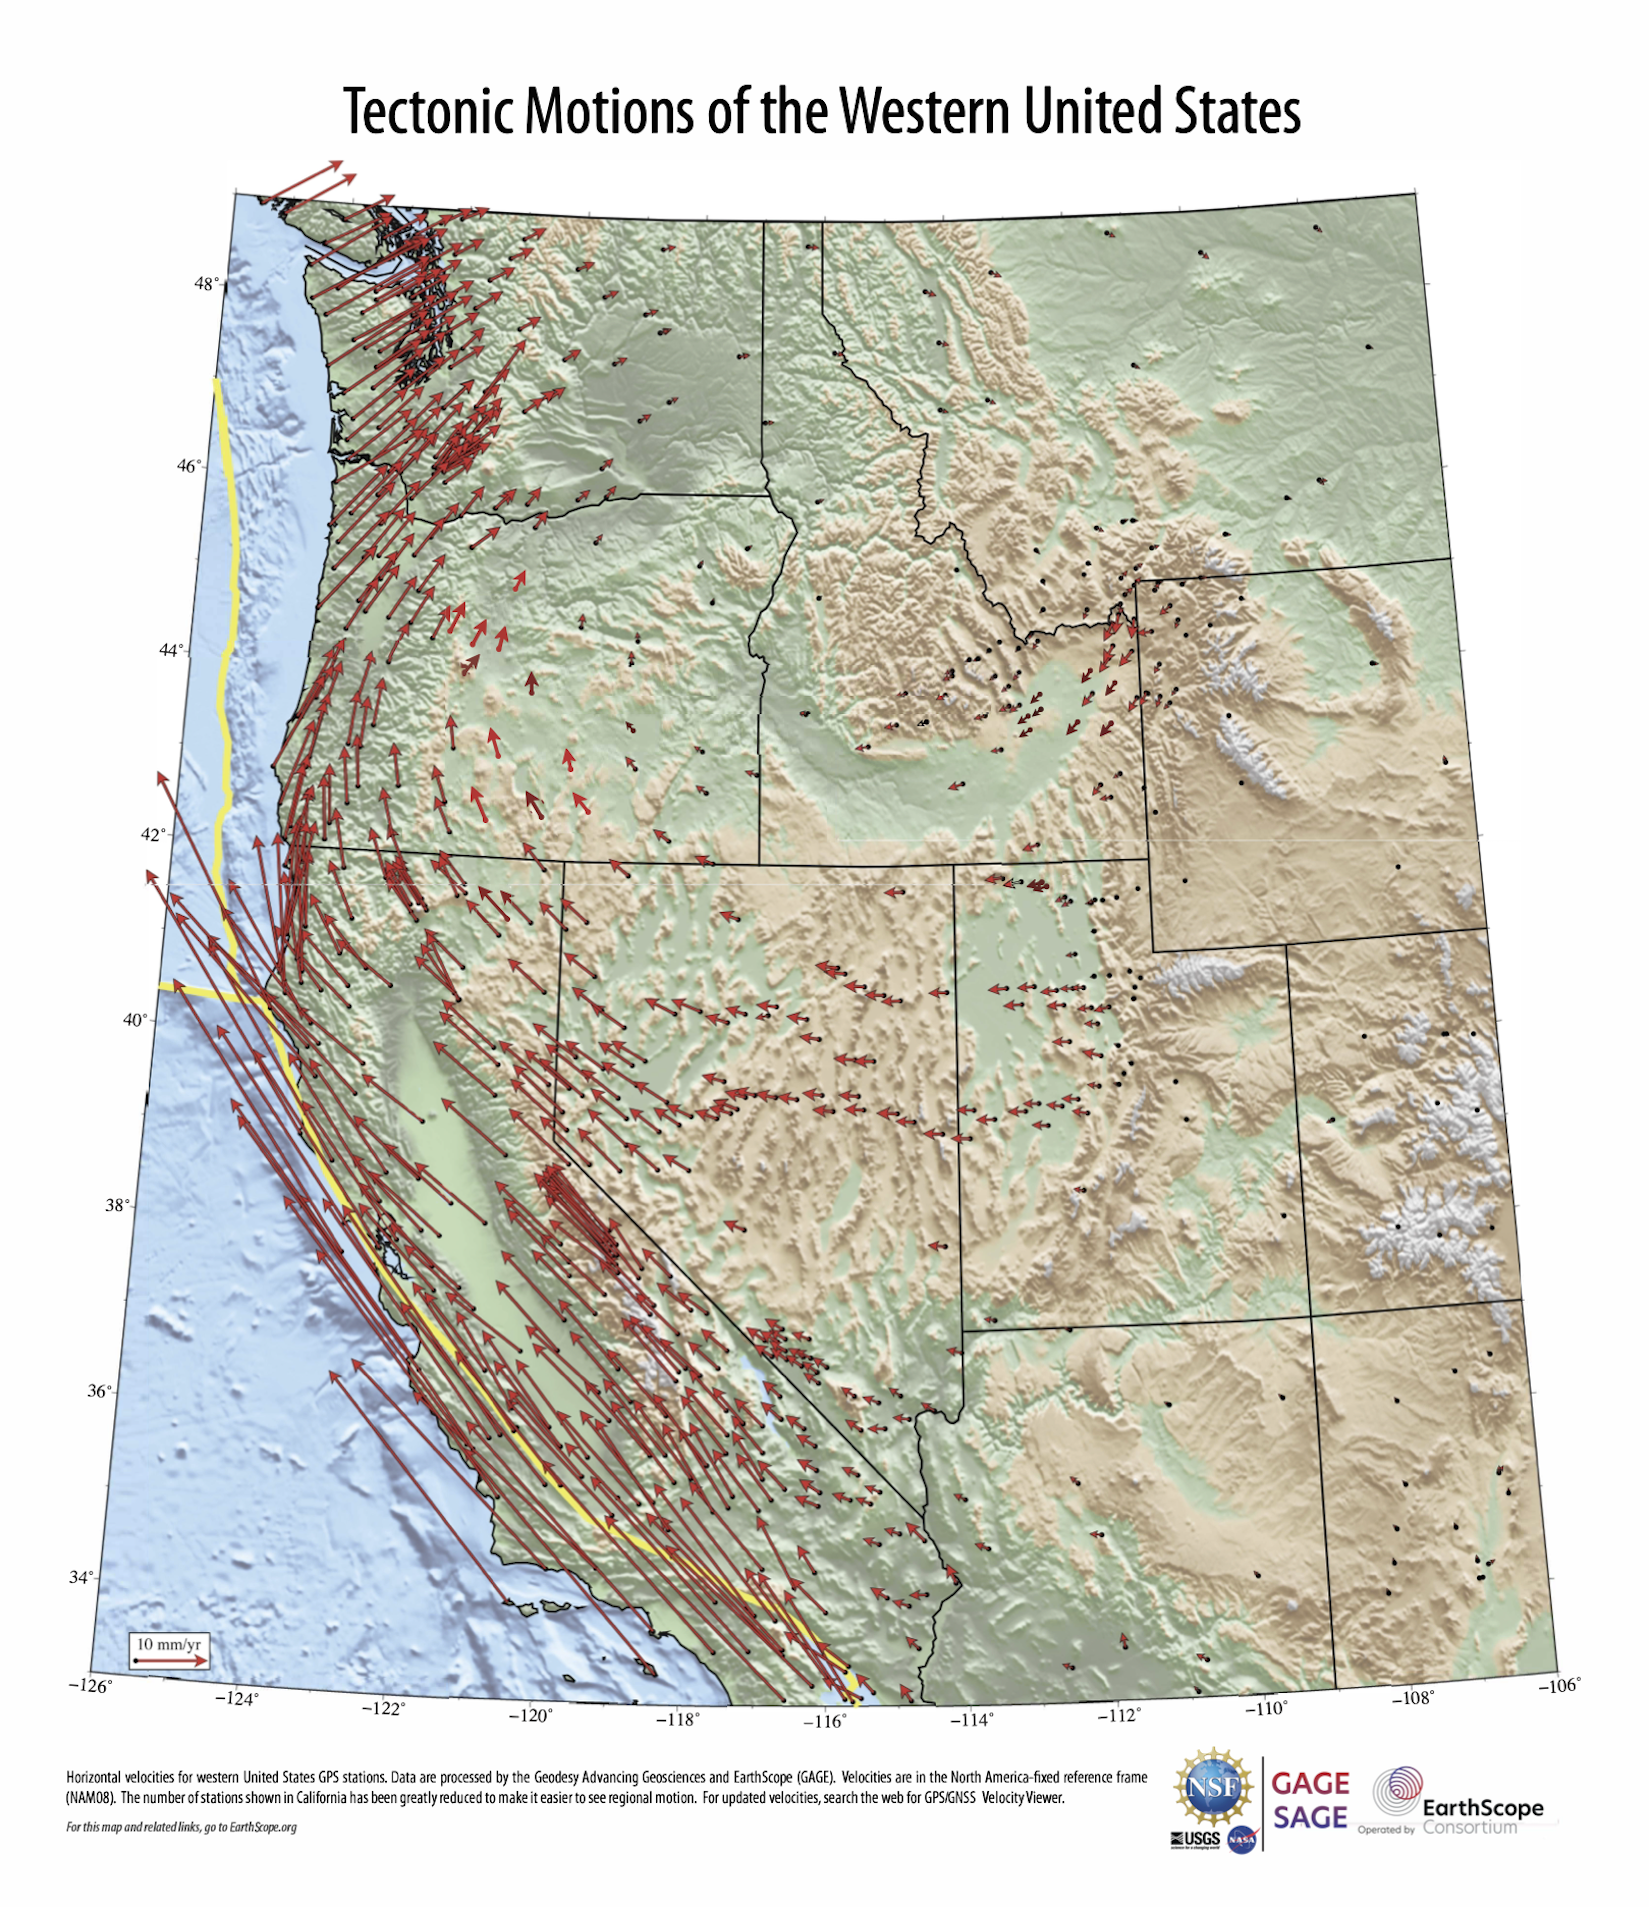
Tectonic Motion Measured by GPS
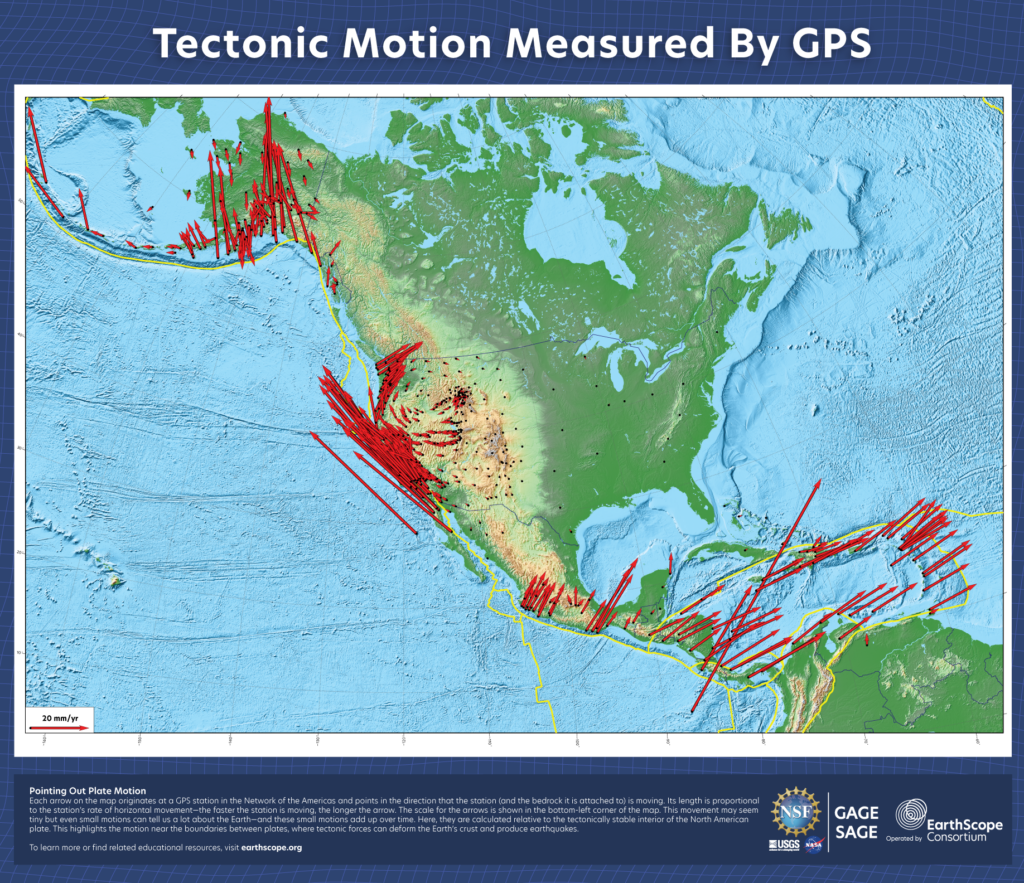
Explore large-scale tectonic motion as measured by the Network of the Americas. Created by Scott Johnson and Christine Puskas. Print as a 22″ x 25.5″ poster.
Download high-resolution files
Front: PDF or PNG
Back: PDF or PNG
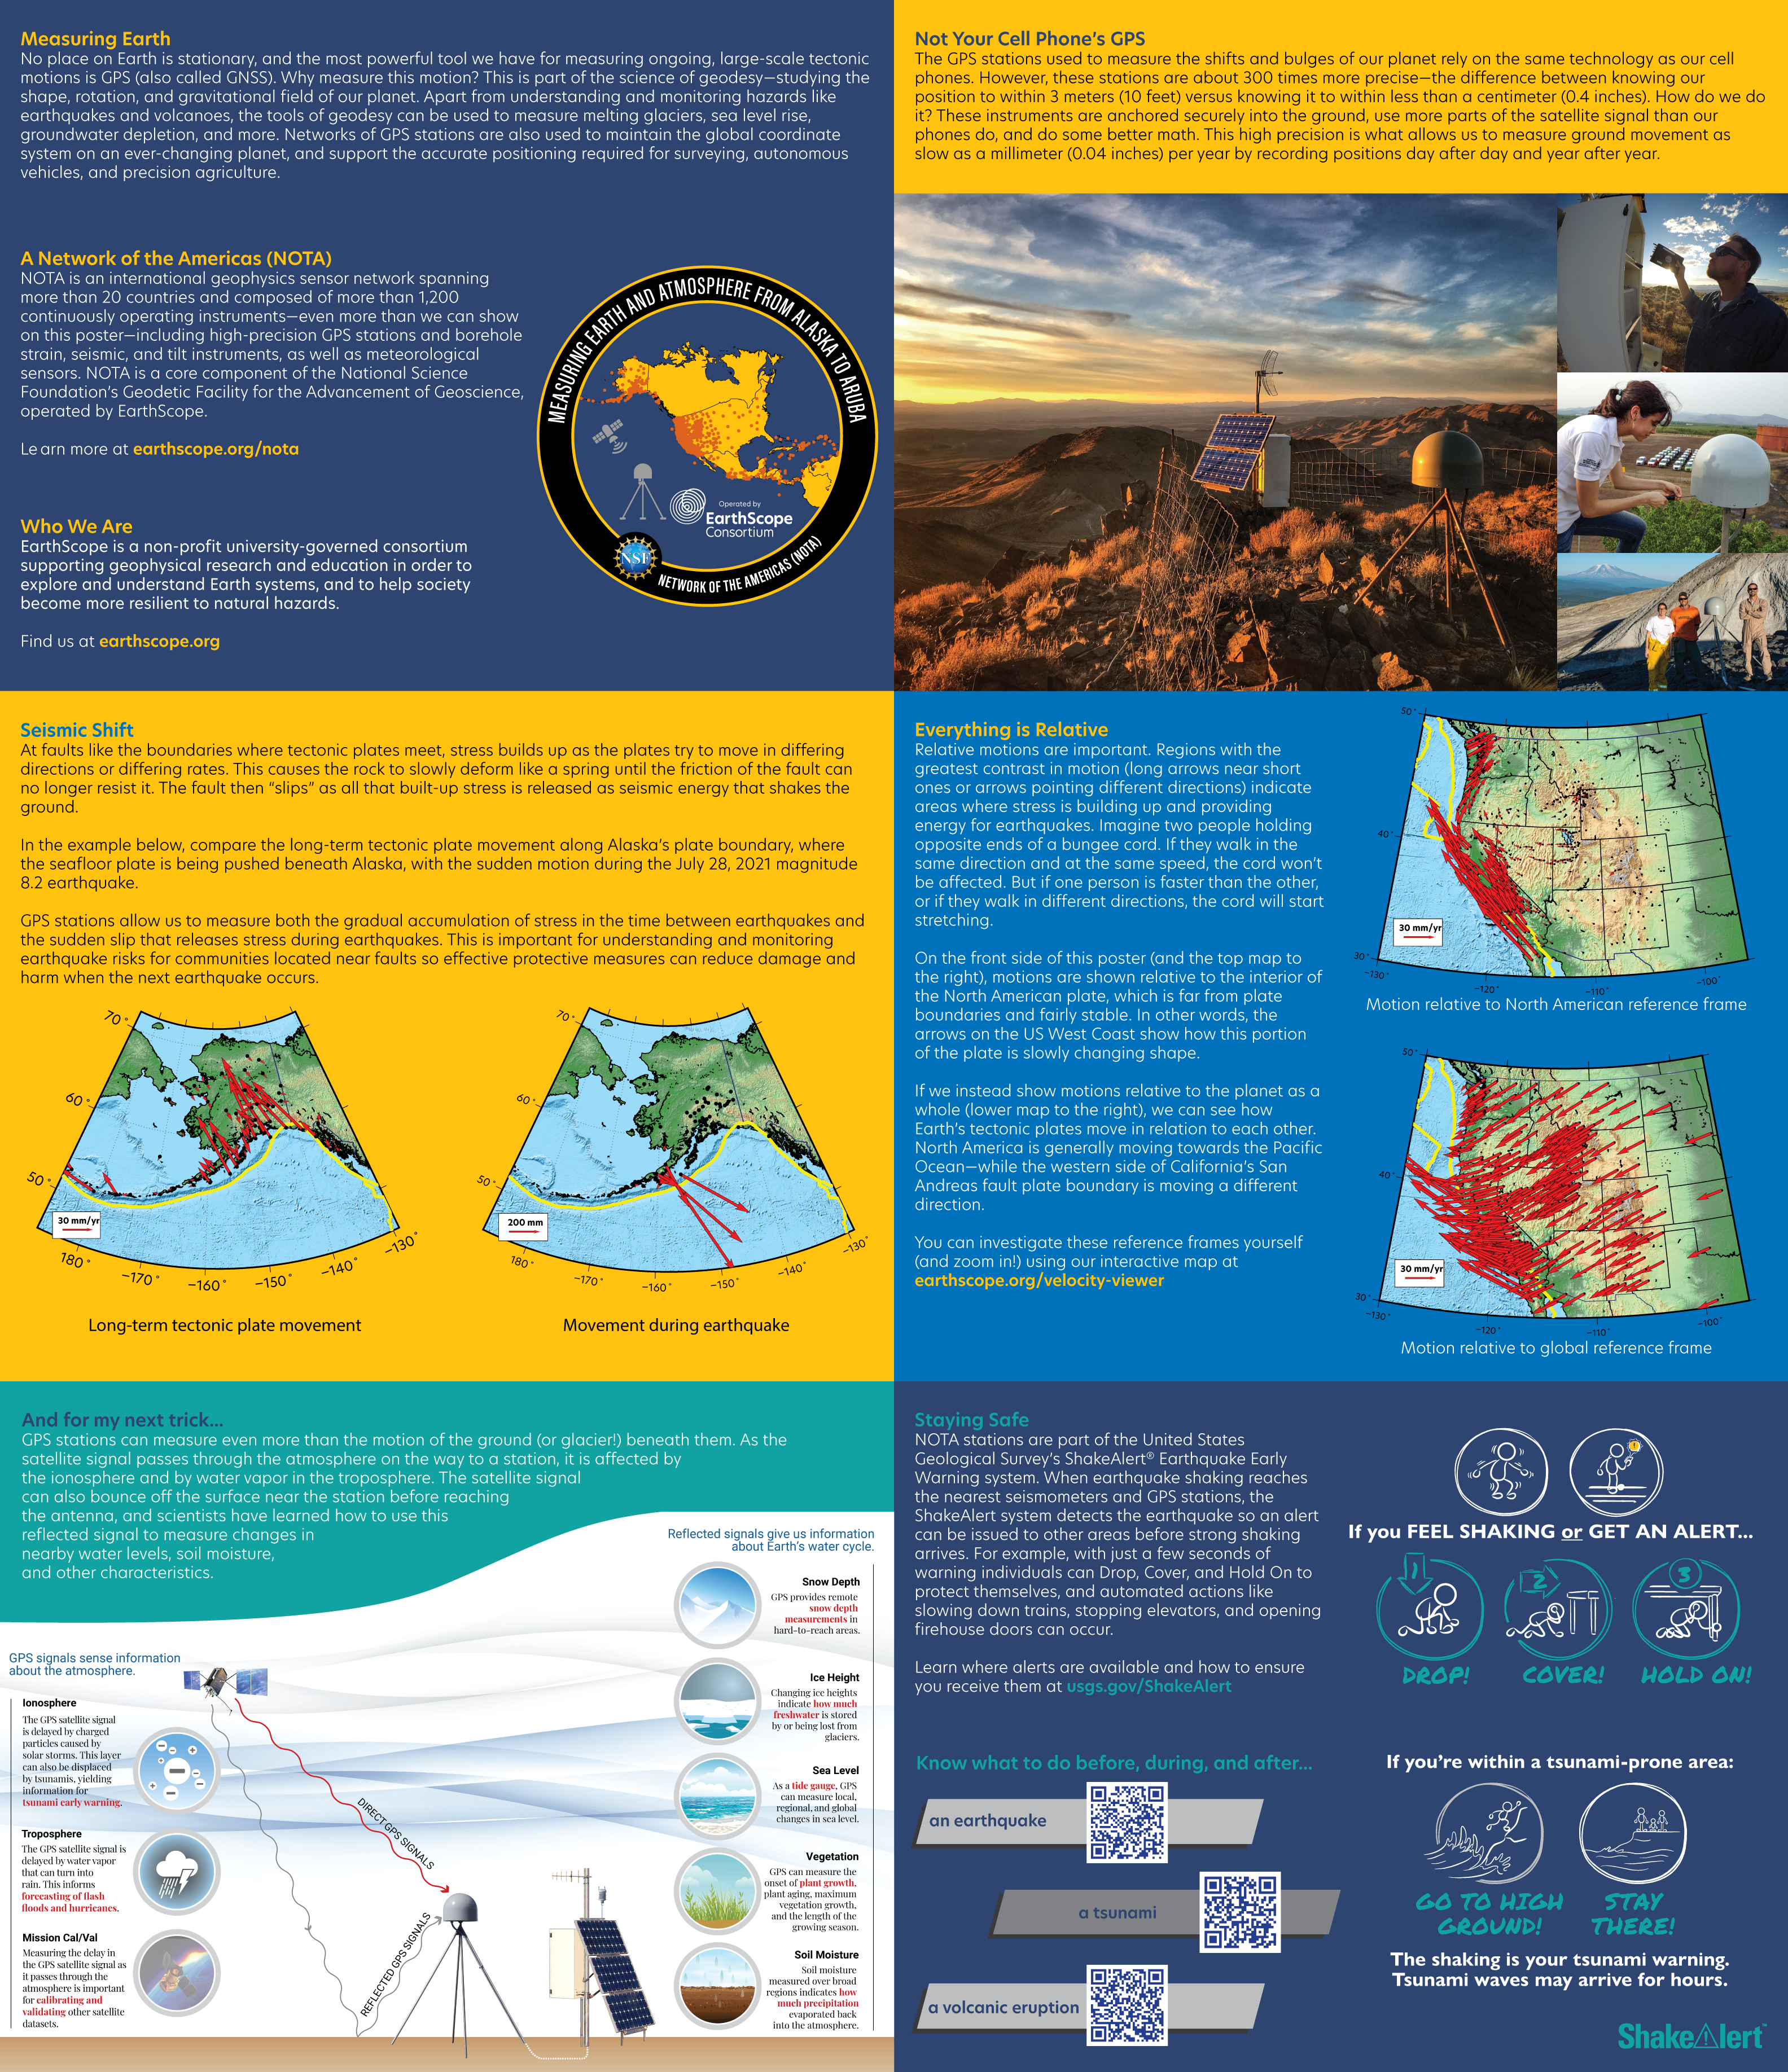
The Science of Geodesy (trifold brochure)
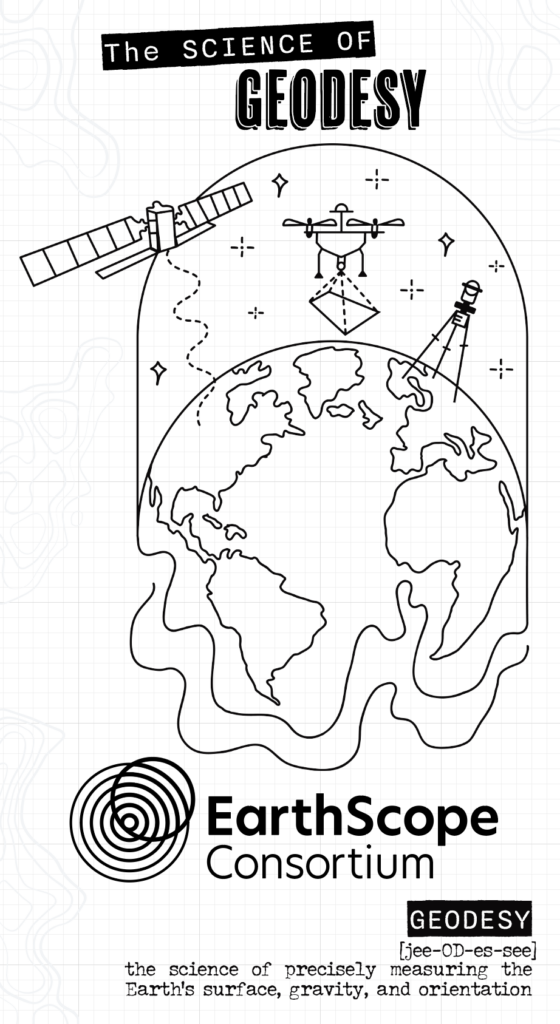
This trifold brochure used for public outreach describes several applications of GPS stations in the Network of the Americas, including water resources, plate tectonics, weather forecasting, and the ShakeAlert Earthquake Early Warning System. Created by Scott Johnson and Elizabeth Ashley.
Download high-resolution PDF
What GPS Can Tell Us About Earth
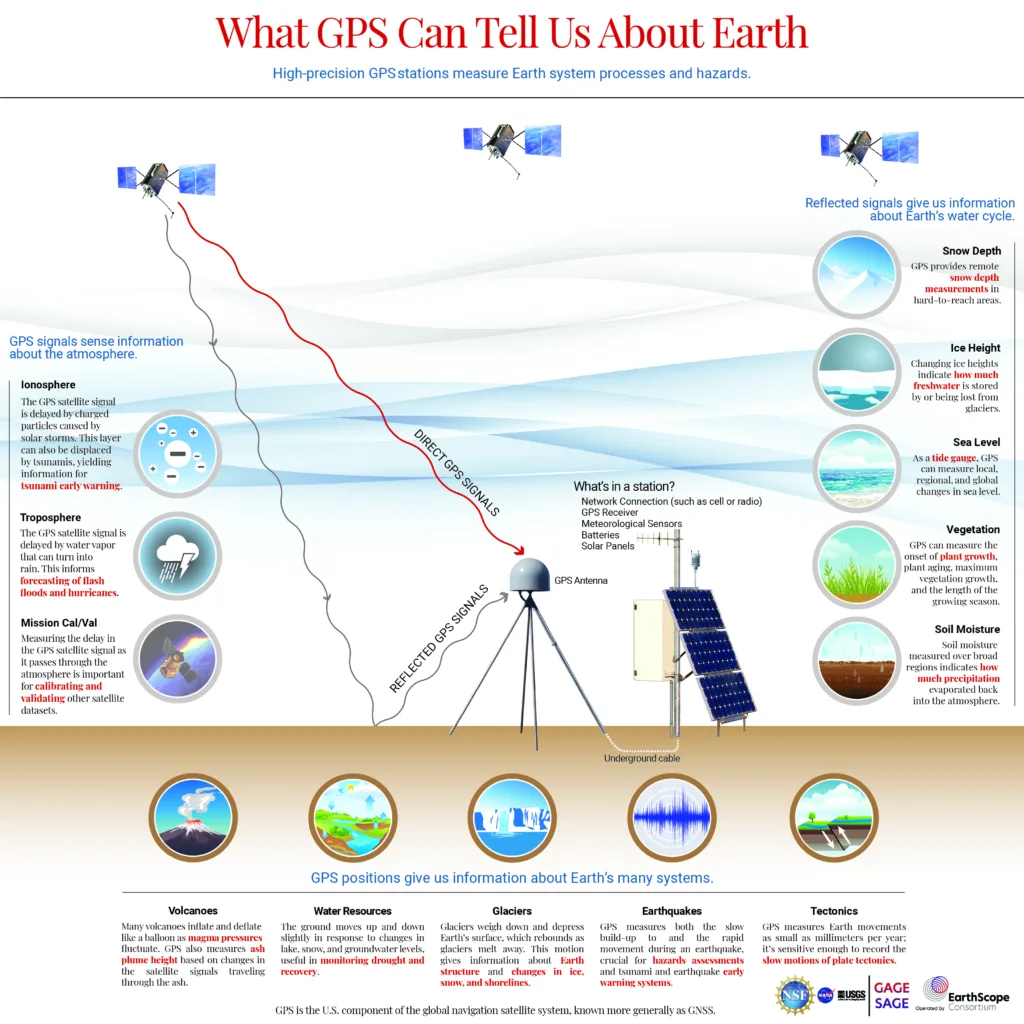
GPS is helpful for more than just navigation. Explore how scientists can use GPS to measure plate tectonics, earthquakes, snow depth, sea level, and more with this posters. Created by Beth Bartel and Daniel Zietlow with assistance from Gene Malowany, updated by Lucia Bellino. Print as a 22″ x 22.5″ poster.
Download as high-resolution PDF or PNG
Measuring Groundwater
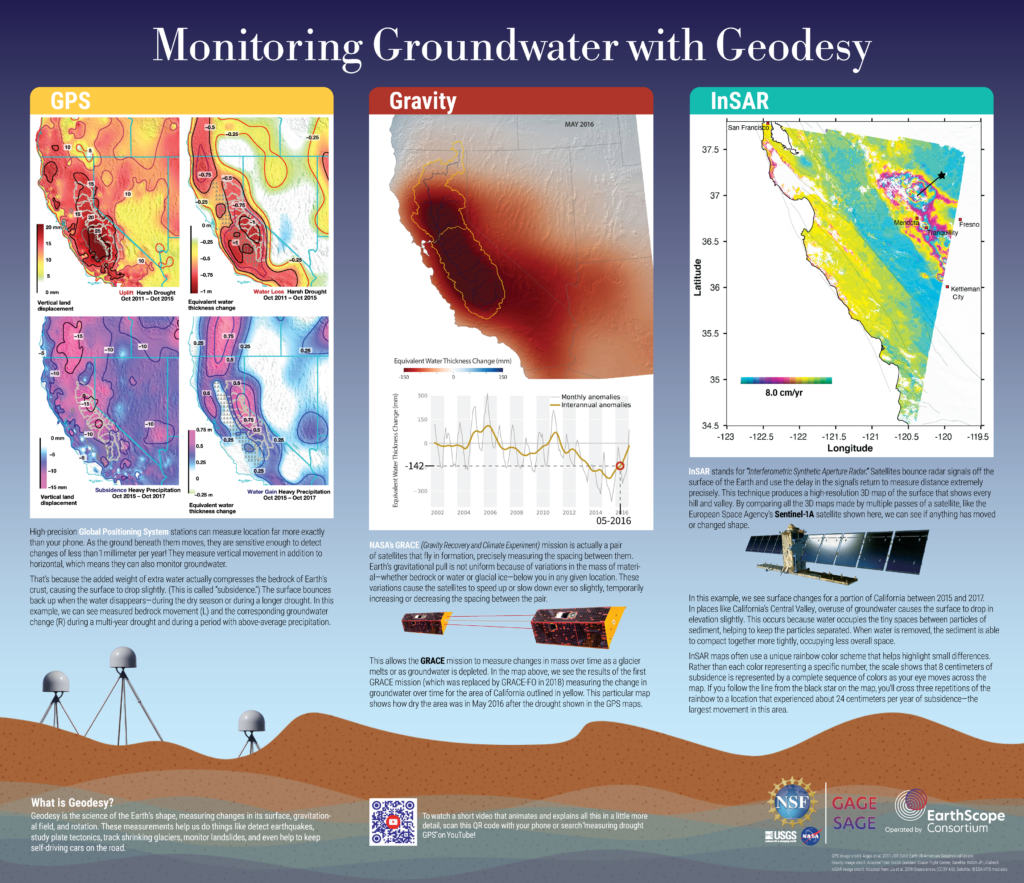
Geodesy provides multiple tools that can detect changes in water resources. Learn how GPS data, satellite gravity instruments, and InSAR can track groundwater change, using the example of California. This poster was created by Scott Johnson with assistance from Gene Malowany. Spanish translation by Marina La Grave. Print size is 22″ x 25.5″.
Download as high-resolution PDF in English or Spanish
InSAR
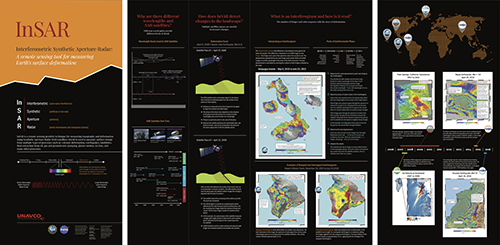
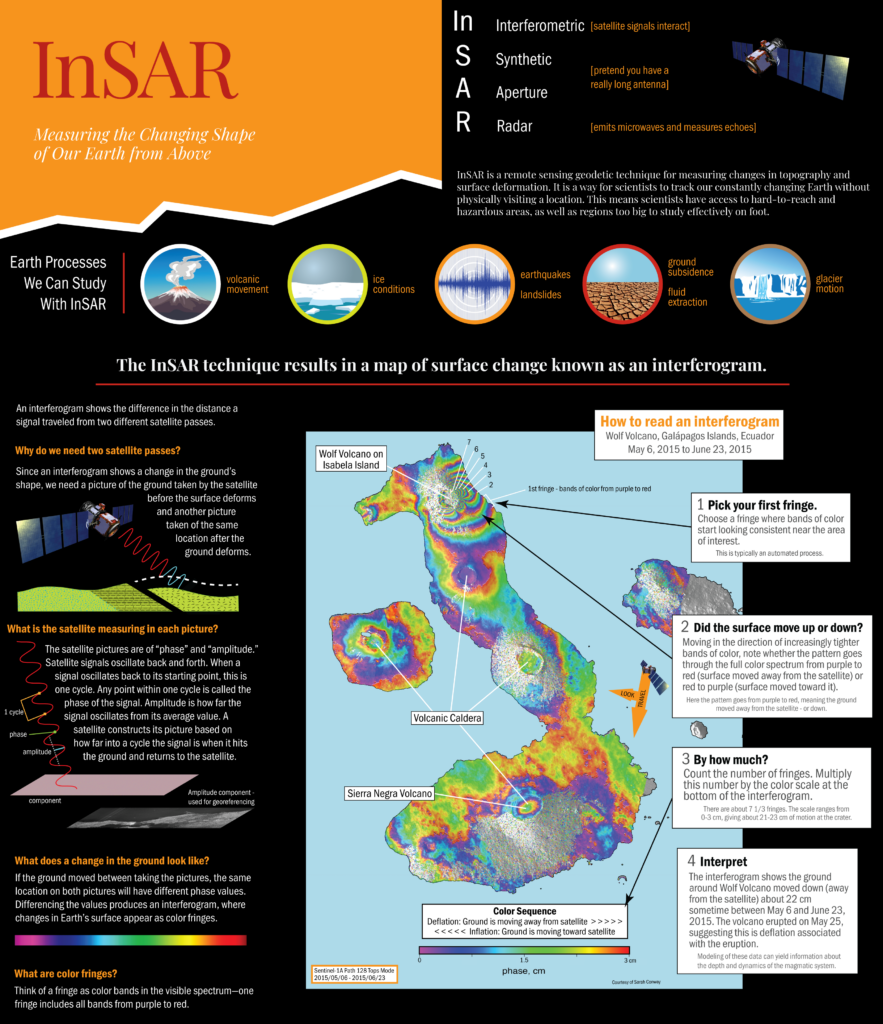
Learn about InSAR, a remote sensing geodetic technique for measuring topography and deformation. InSAR can measure cm-level changes in the landscape from earthquakes, volcano deformation, groundwater withdrawl, and more. This poster was created by Sarah Moore, 2016 USIP Intern, with assistance from Shelley Olds, Scott Baker, and Gene Malowany. Designed as a three-paneled wall mounted poster. The center panel is 4′ x 4′ and the side panels are 2′ x 4′.
Download as high-resolution PDF (archived UNAVCO file)
Reading Interferograms and other InSAR Basics
How do you read an InSAR interferogram and how do we use them to study our Earth? Learn more with this poster suitable for introductory and upper-level geoscience classrooms. This poster was developed by Daniel Zietlow and Beth Bartel from a poster created by Sarah Moore, Shelley Olds, Scott Baker, and Gene Malowany, with input from Beth Pratt-Sitaula. Special thanks to Gareth Funning for review and contributions. Print as a 22.5″ x 26″ poster.
Download high-resolution files
Front: PDF PNG
Back: PDF PNG
What is Geodesy?
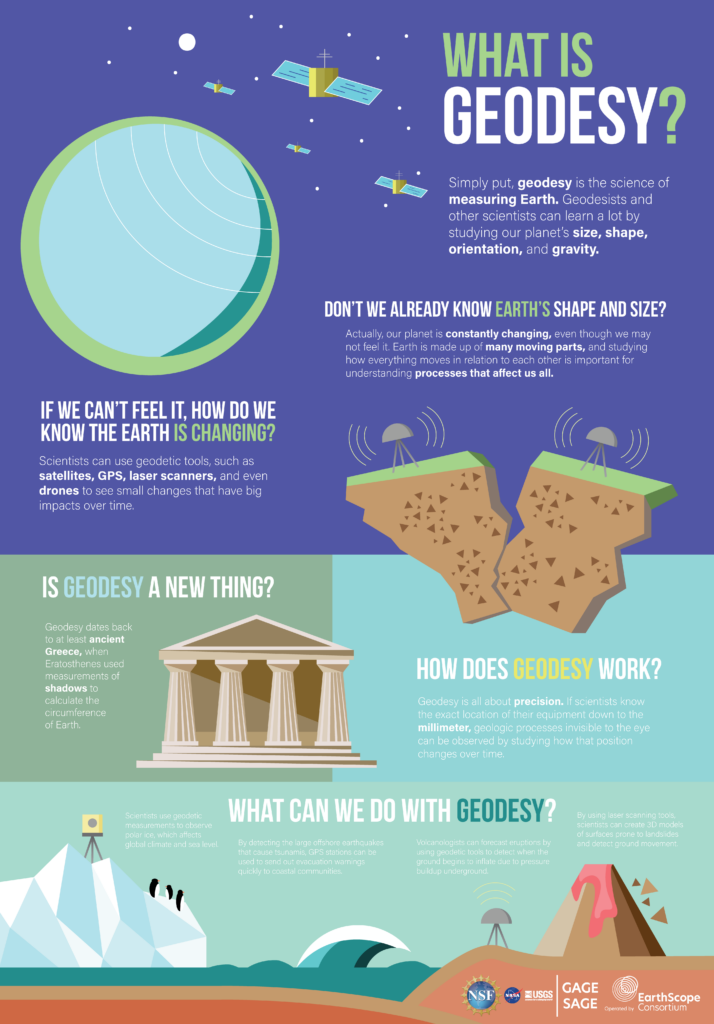
What is geodesy? How does geodesy work? What can we do with geodesy? Explore these questions and more with this introductory poster. This poster was created by Christopher Chase Edmunds. Print as a 15″ x 21.5″ poster. Spanish translation contributed by Franco Sebastian Sobrero, Universidad Nacional del Litoral, Argentina. French and German translations courtesy of Swisstopo.
Download high-resolution files
English: PDF PNG
Spanish version: PDF JPG (archived UNAVCO files)
German version: PDF (archived UNAVCO files)
French version: PDF (archived UNAVCO files)
Geodetic Toolbox
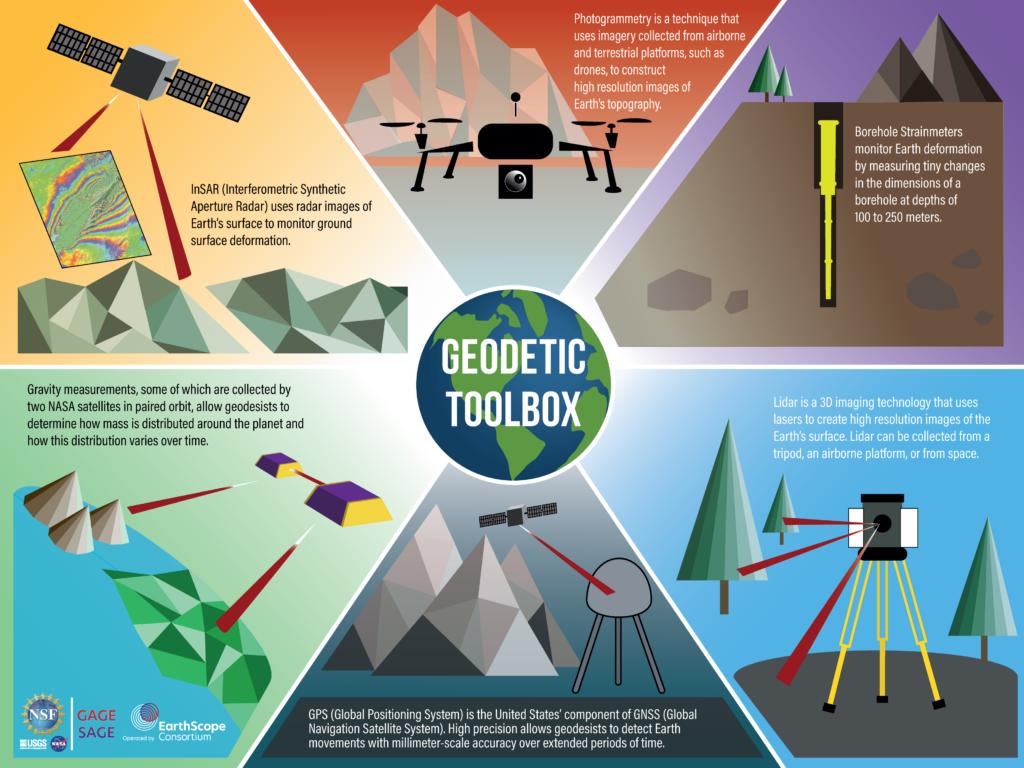
Geodetic instruments measure the changing shape of our Earth underground, at the surface, in the air, and from space. Learn more about GPS, InSAR, lidar, gravity, borehole instrumentation, and photogrammetry with this poster created by Ellie Ellis and updated by Zach Courter.
Download as high-resolution PDF or PNG
Tectonic Motion Maps
These maps display velocities of Global Positioning System (GPS) stations around the world on posters that are ideal for classrooms or labs. These velocities show how the surface of the Earth is changing over time as a result of plate tectonics.

Download updated map as PNG or PDF
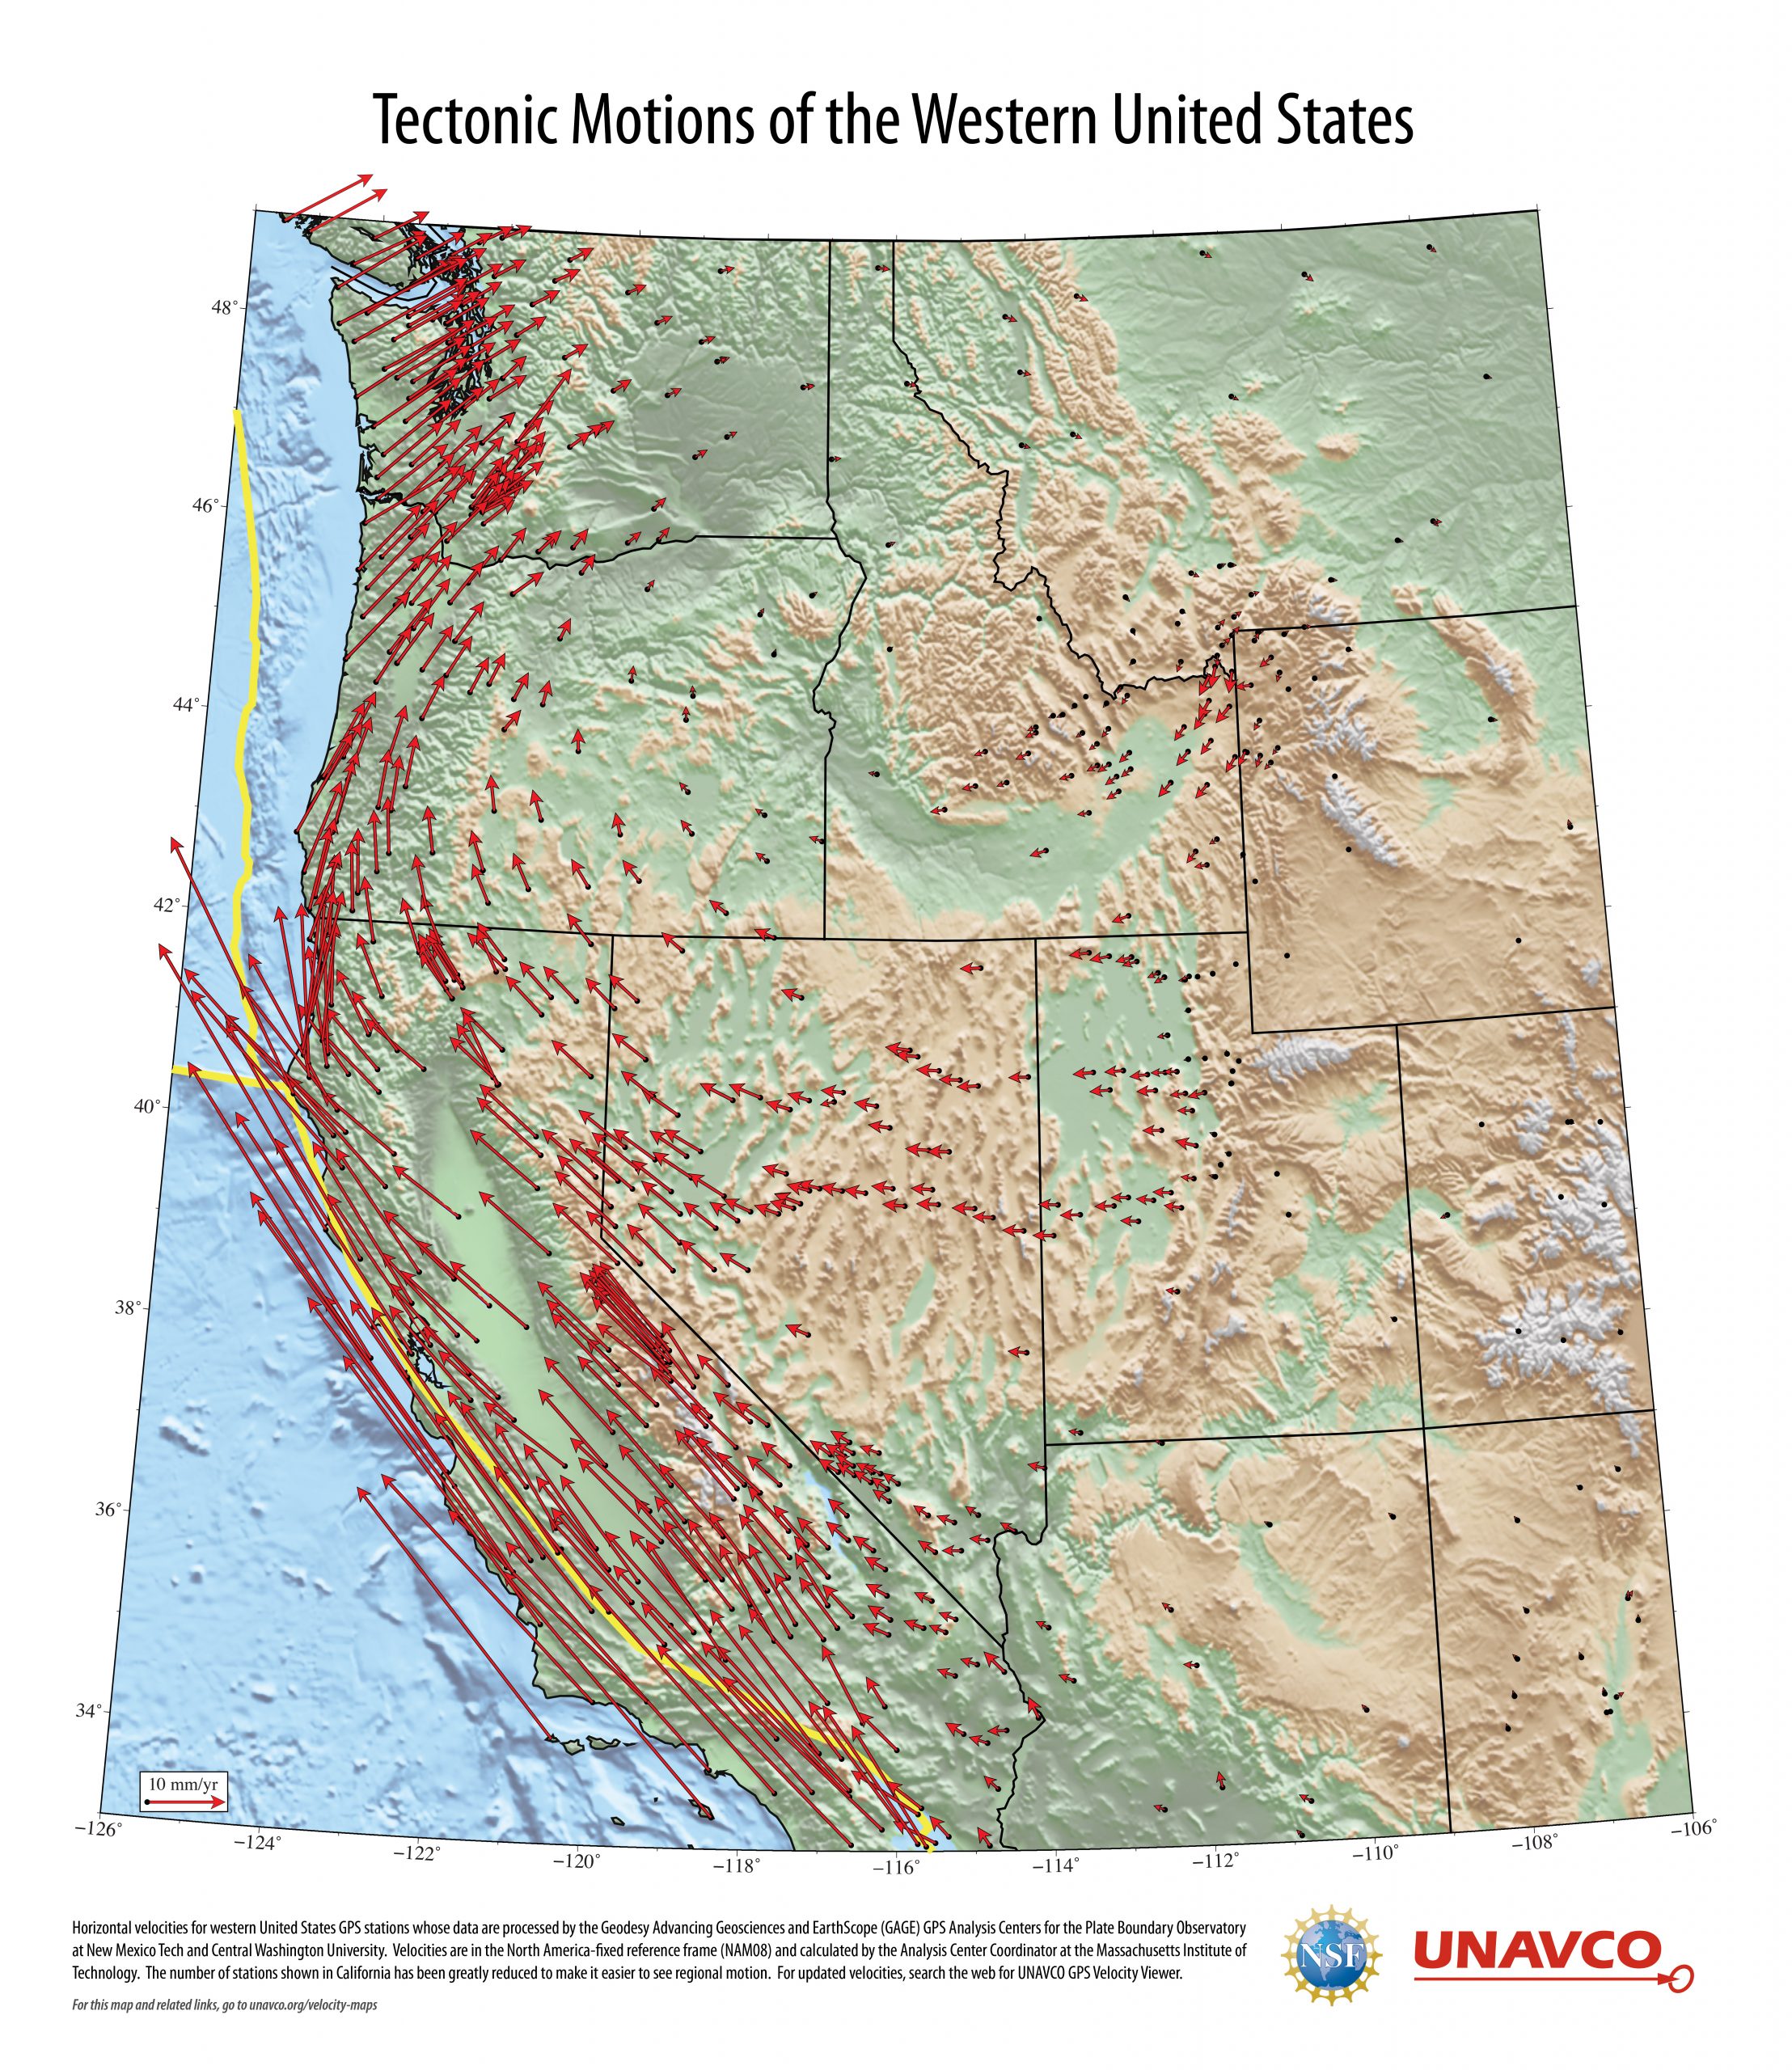
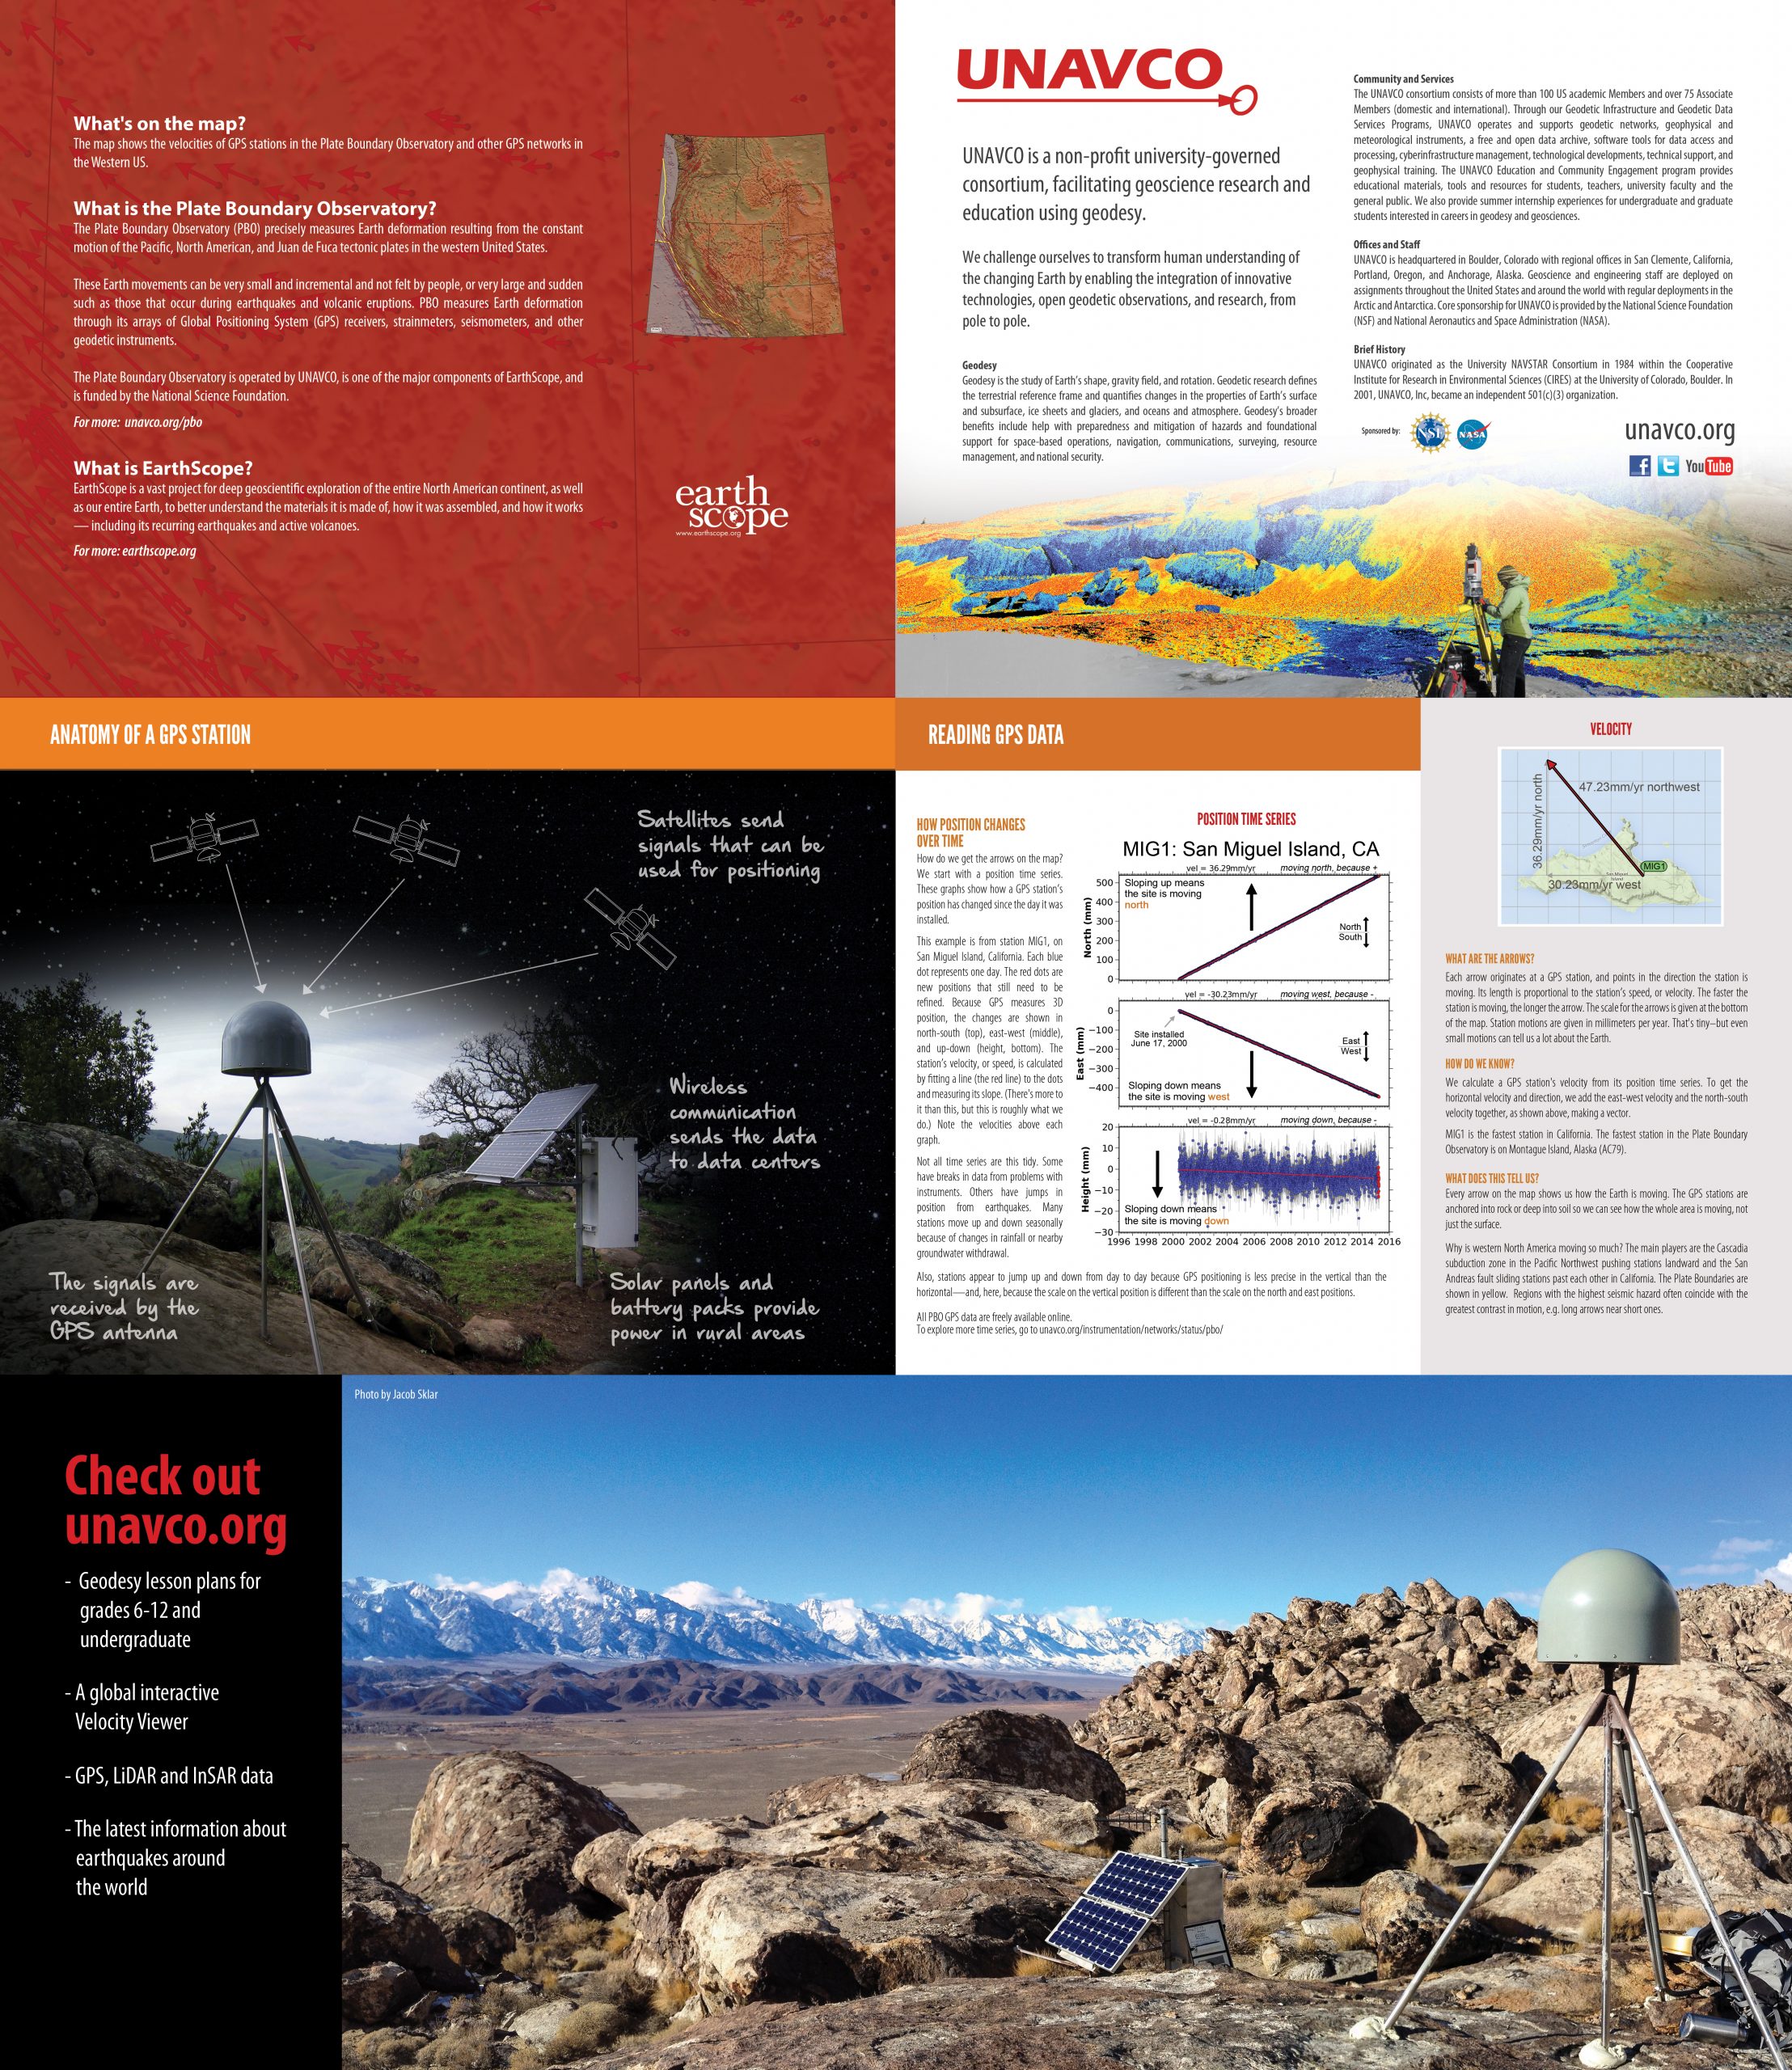
Download Western United States poster as high-resolution PDF front and back (archived UNAVCO files)
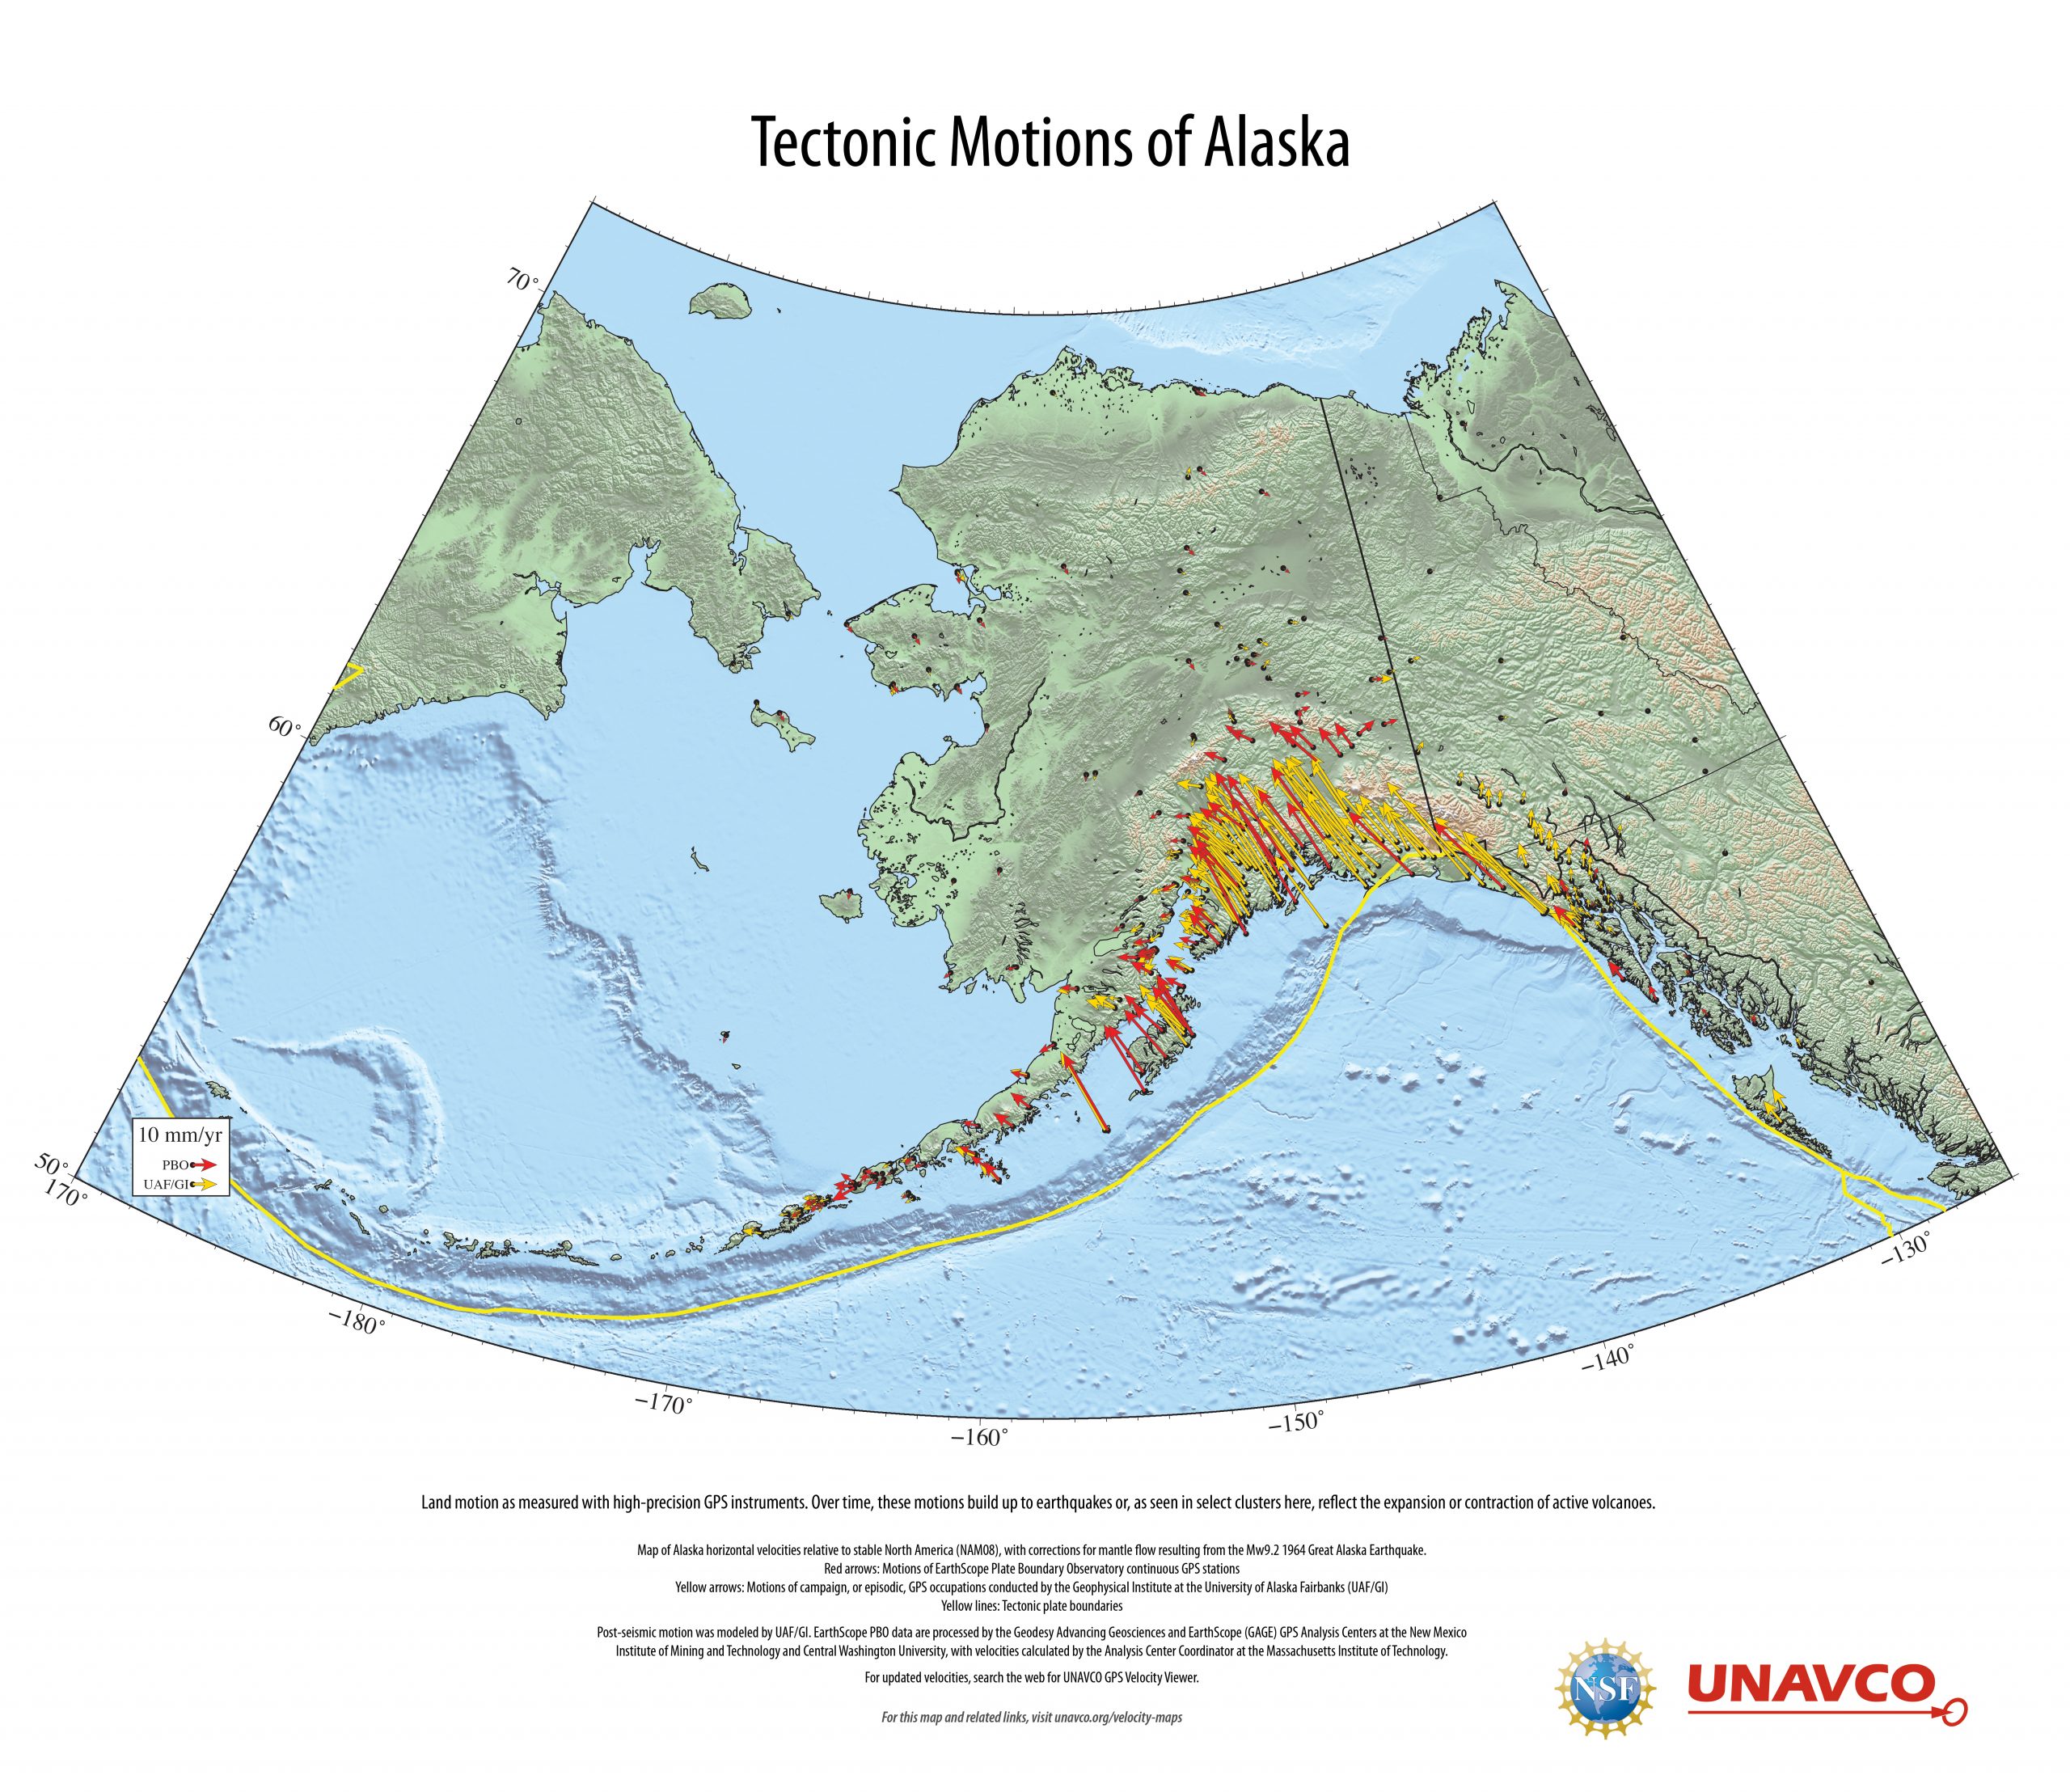
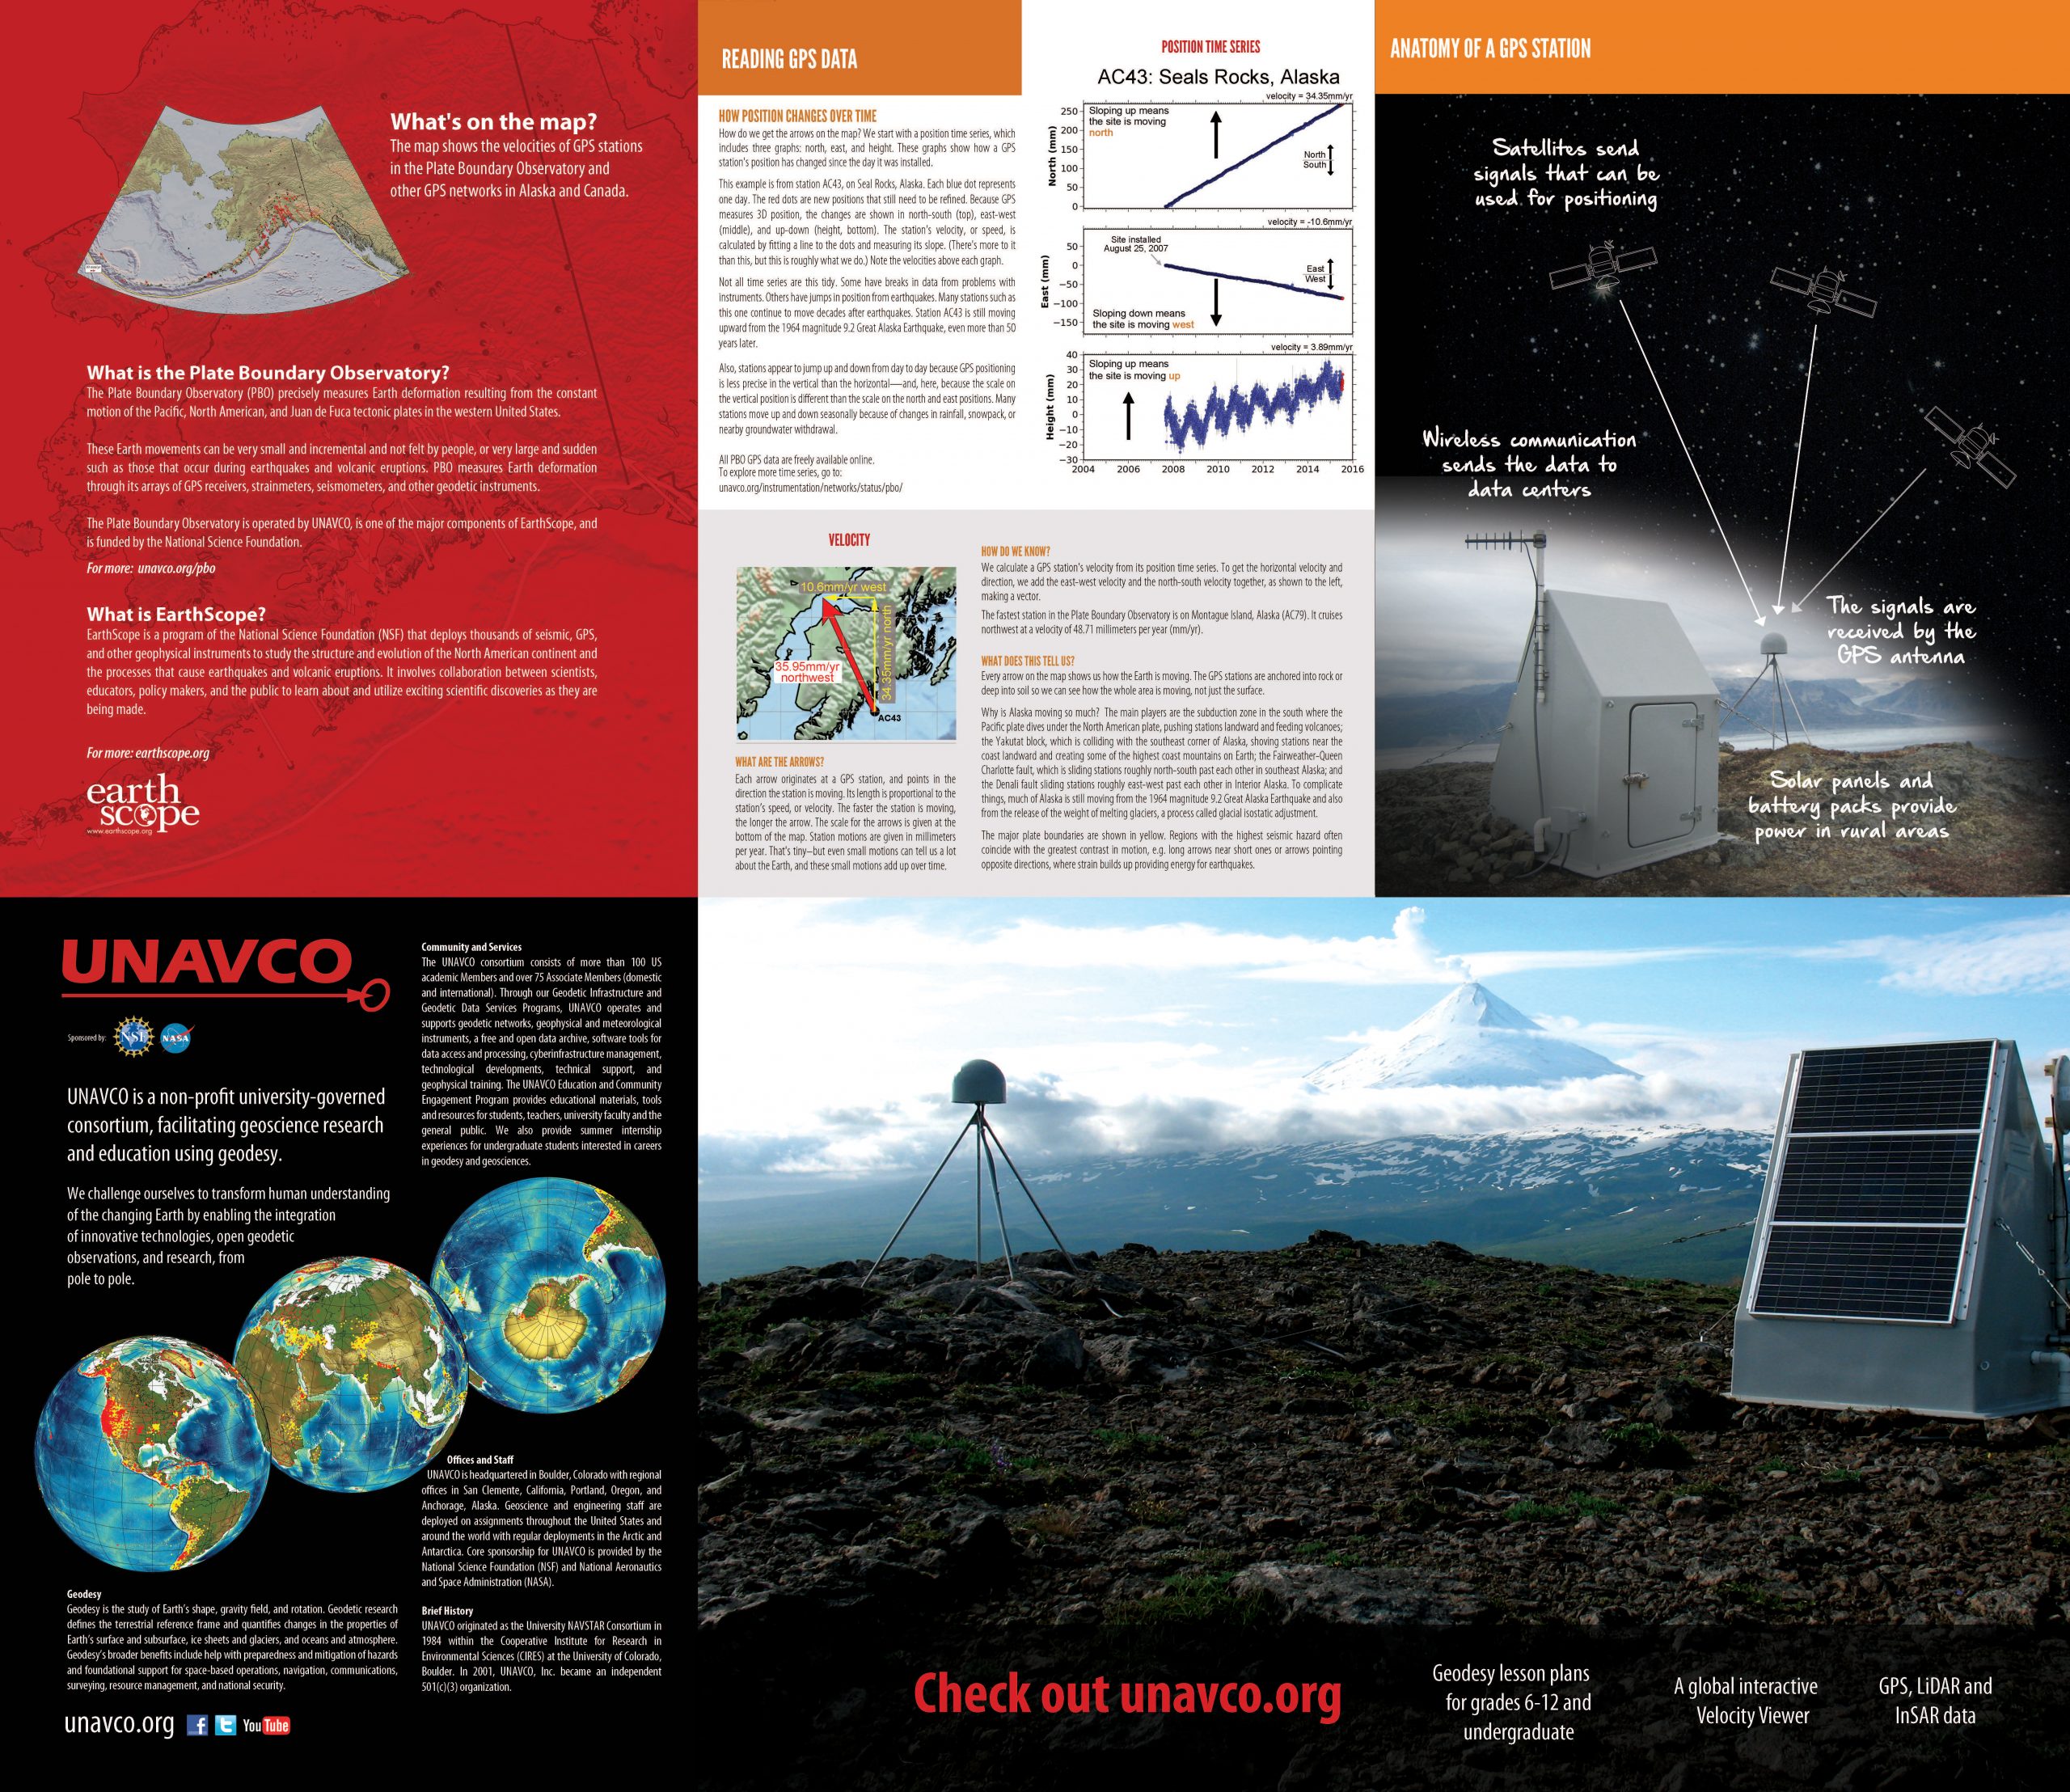
Download Alaska poster as high-resolution PDF front and back (archived UNAVCO files)
“I want to be a geoscientist” flyer
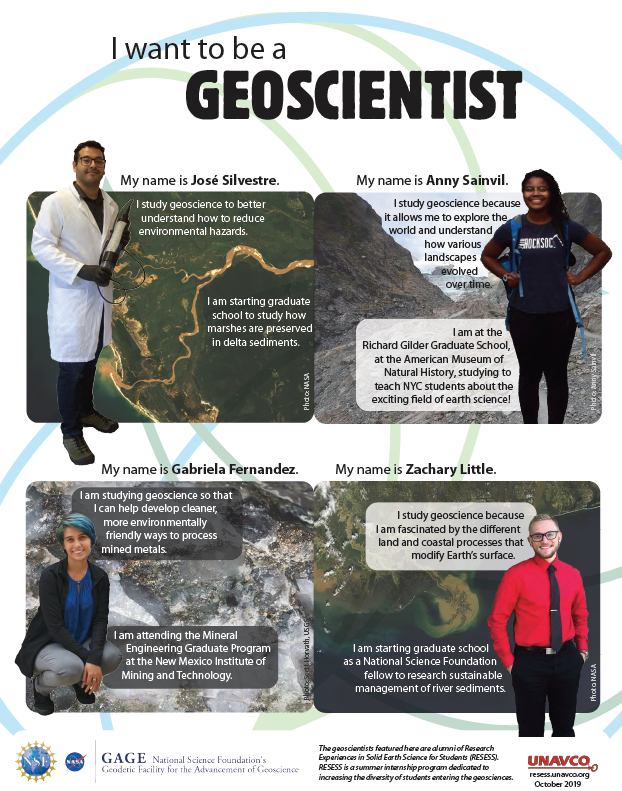
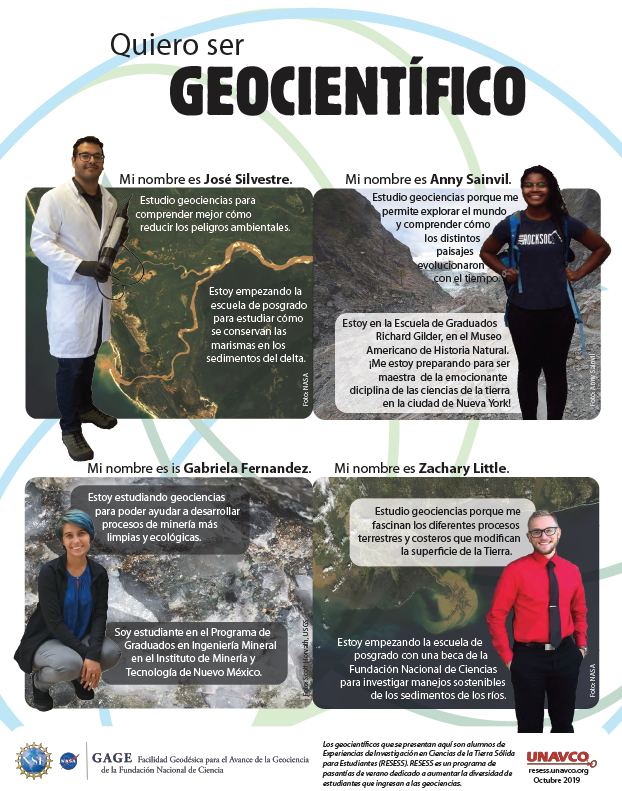
This page-sized flyer features four alumni of the RESESS internship program. English on one side, Spanish on the other.
Download as PDF (archived UNAVCO files)
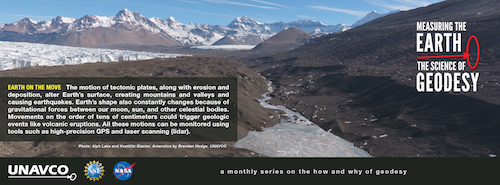
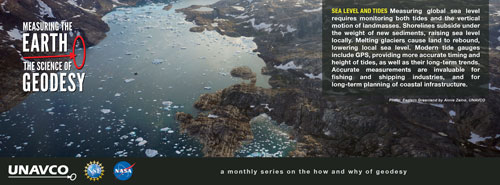
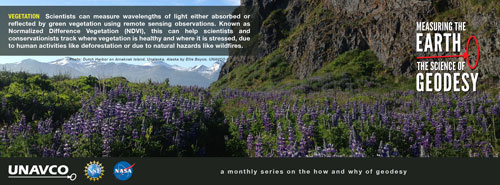
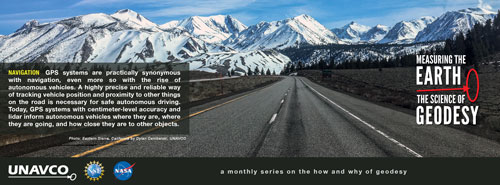
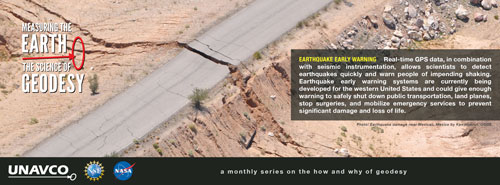
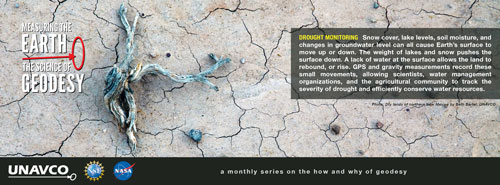
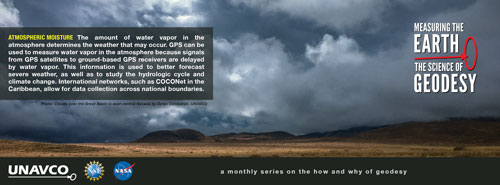
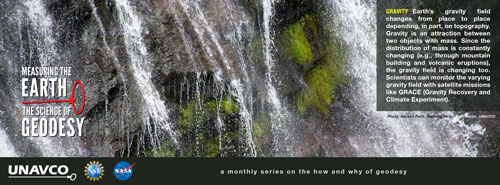
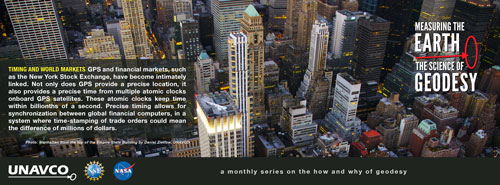
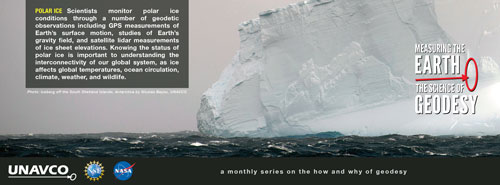
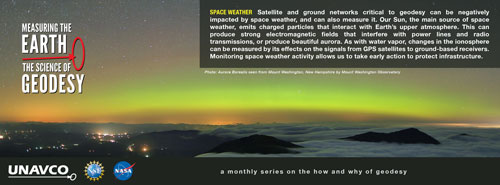
Measuring the Earth: The Science of Geodesy
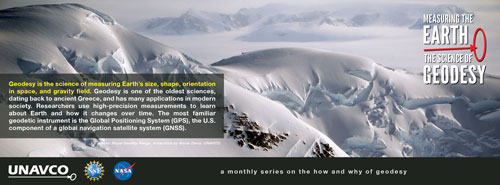
What is geodesy, and how does this science serve society? This series, based on content from the 2018 UNAVCO calendar, explores these questions by highlighting geodesy’s many applications. Created by Daniel Zietlow with assistance from Beth Bartel.
This series was also adapted into a single poster translated into French (PDF) and German (PDF) by Swisstopo. (archived UNAVCO files)

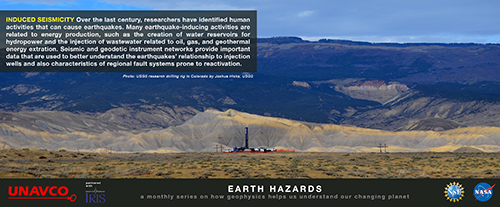
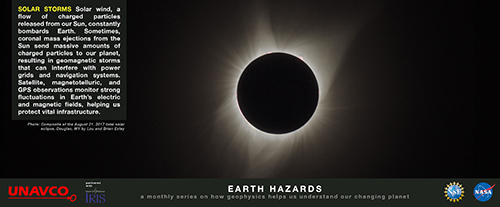
Earth Hazards
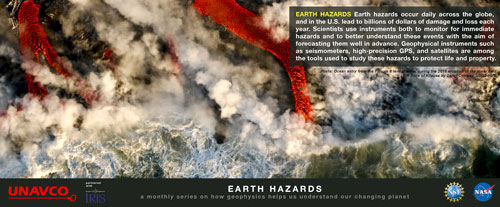
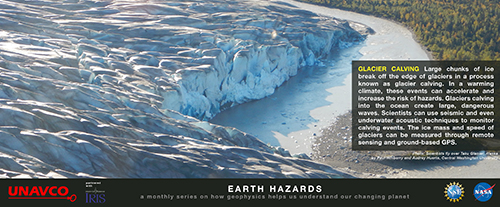
Our dynamic planet’s active processes yield the beauty of mountains as well as the dangers of earthquakes, volcanoes, landslides and more. This series, based on content from the 2019 UNAVCO-IRIS calendar, highlights the ongoing contributions of geodesy and seismology to understanding Earth hazards. Created by Daniel Zietlow, Kelsey Russo-Nixon, and Beth Bartel.

Earth hazards occur daily across the globe, and in the U.S. lead to billions of dollars of damage and loss each year.
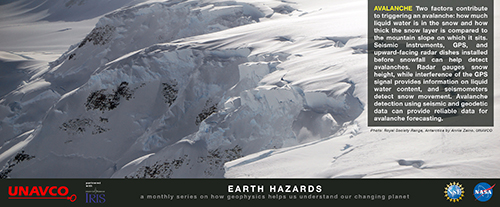
Two factors contribute to triggering an avalanche: how much liquid water is in the snow and how thick the snow layer is compared to the mountain slope on which it sits.
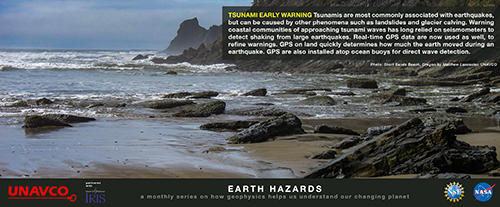
Tsunamis are most commonly associated with earthquakes, but can be caused by other phenomena such as landslides and glacier calving.
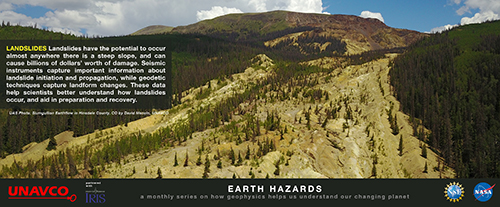
Landslides have the potential to occur almost anywhere there is a steep slope, and can cause billions of dollars’ worth of damage.
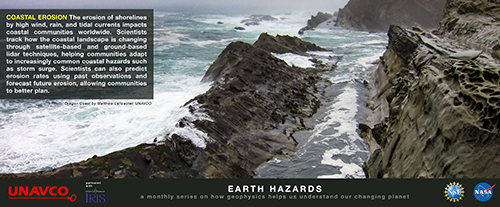
The erosion of shorelines by high wind, rain, and tidal currents impacts coastal communities worldwide.
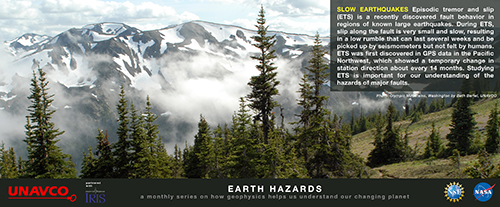
Episodic tremor and slip (ETS) is a recently discovered fault behavior in regions of known large earthquakes.
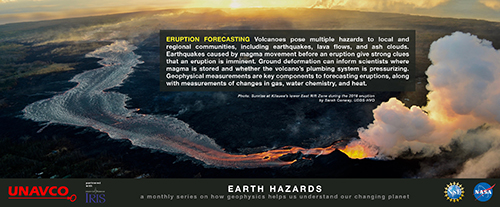
Volcanoes pose multiple hazards to local and regional communities, including earthquakes, lava flows, and ash clouds.
Seeing our Earth 2020
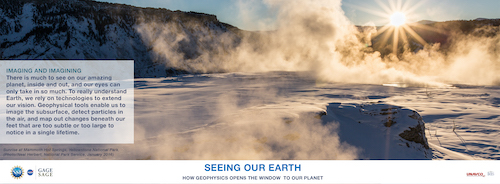
There is much to see on our amazing planet, inside and out, and our eyes can only take in so much. This series, based on content from the 2020 GAGE-SAGE calendar produced by UNAVCO and IRIS, explores how geophysical technologies extend our vision. Created by Kelsey Russo-Nixon with assistance from Beth Bartel.

There is much to see on our amazing planet, inside and out, and our eyes can only take in so much. To really understand Earth, we rely on technologies to extend our vision.
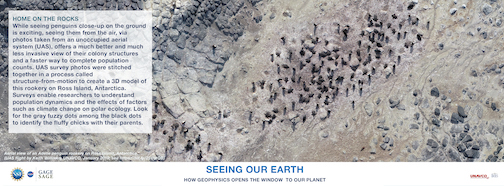
While seeing penguins close-up on the ground is exciting, seeing them from the air, via photos taken from an unoccupied aerial system (UAS), offers a much better and much less invasive view of their colony structures and a faster way to complete population counts.
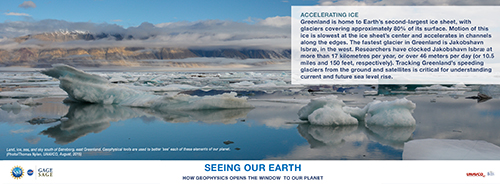
Greenland is home to Earth’s second-largest ice sheet, with glaciers covering approximately 80% of its surface. Tracking Greenland’s speeding glaciers is critical for understanding current and future sea level rise.
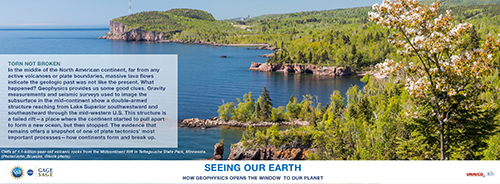
In the middle of the North American continent, far from any active volcanoes or plate boundaries, massive lava flows indicate the geologic past was not like the present. What happened?
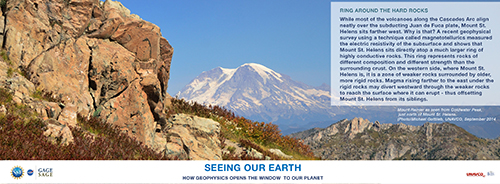
While most of the volcanoes along the Cascades Arc align neatly over the subducting Juan de Fuca plate, Mount St. Helens sits farther west. Why is that?
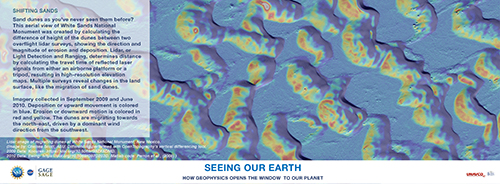
Sand dunes as you’ve never seen them before? This aerial view of White Sands National Monument was created by calculating the difference in height of the dunes between two overflight lidar surveys.
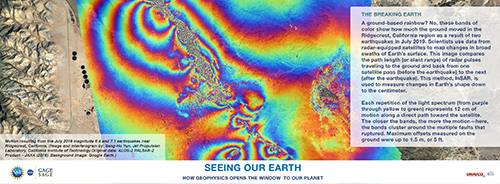
A ground-based rainbow? No, these bands of color show how much the ground moved in the Ridgecrest, California region as a result of two earthquakes in July 2019.
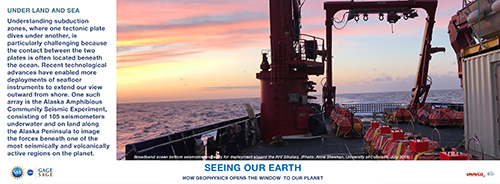
Understanding subductions zones, where one tectonic plate dives under another, is particularly challenging because the contact between the two plates is often located beneath the ocean.
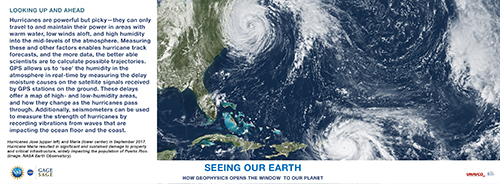
Hurricanes are powerful but picky – they can only travel to and maintain their power in areas with warm water, low winds aloft, and high humidity into the mid-levels of the atmosphere.
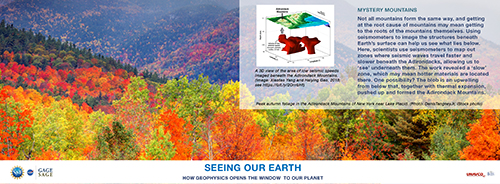
Not all mountains form the same way, and getting at the root cause of mountains may mean getting to the roots of the mountains themselves.
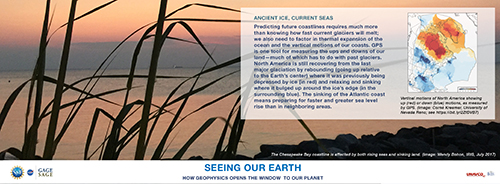
Predicting future coastlines requires much more than knowing how fast current glaciers will melt; we also need to factor in thermal expansion of the oceans and the vertical motions of our coasts.
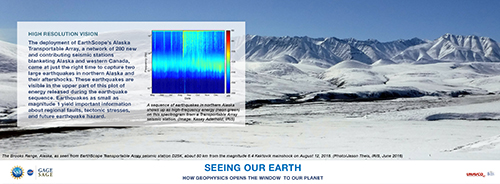
One outcome of improved technology and more sensors is a more detailed picture of the inner workings of Earth.
Home
- Education
- Education Resources
- Last updated: 1 April 2024