
Measure Ground Motion with GPS: How GPS Works | Education | UNAVCO
-
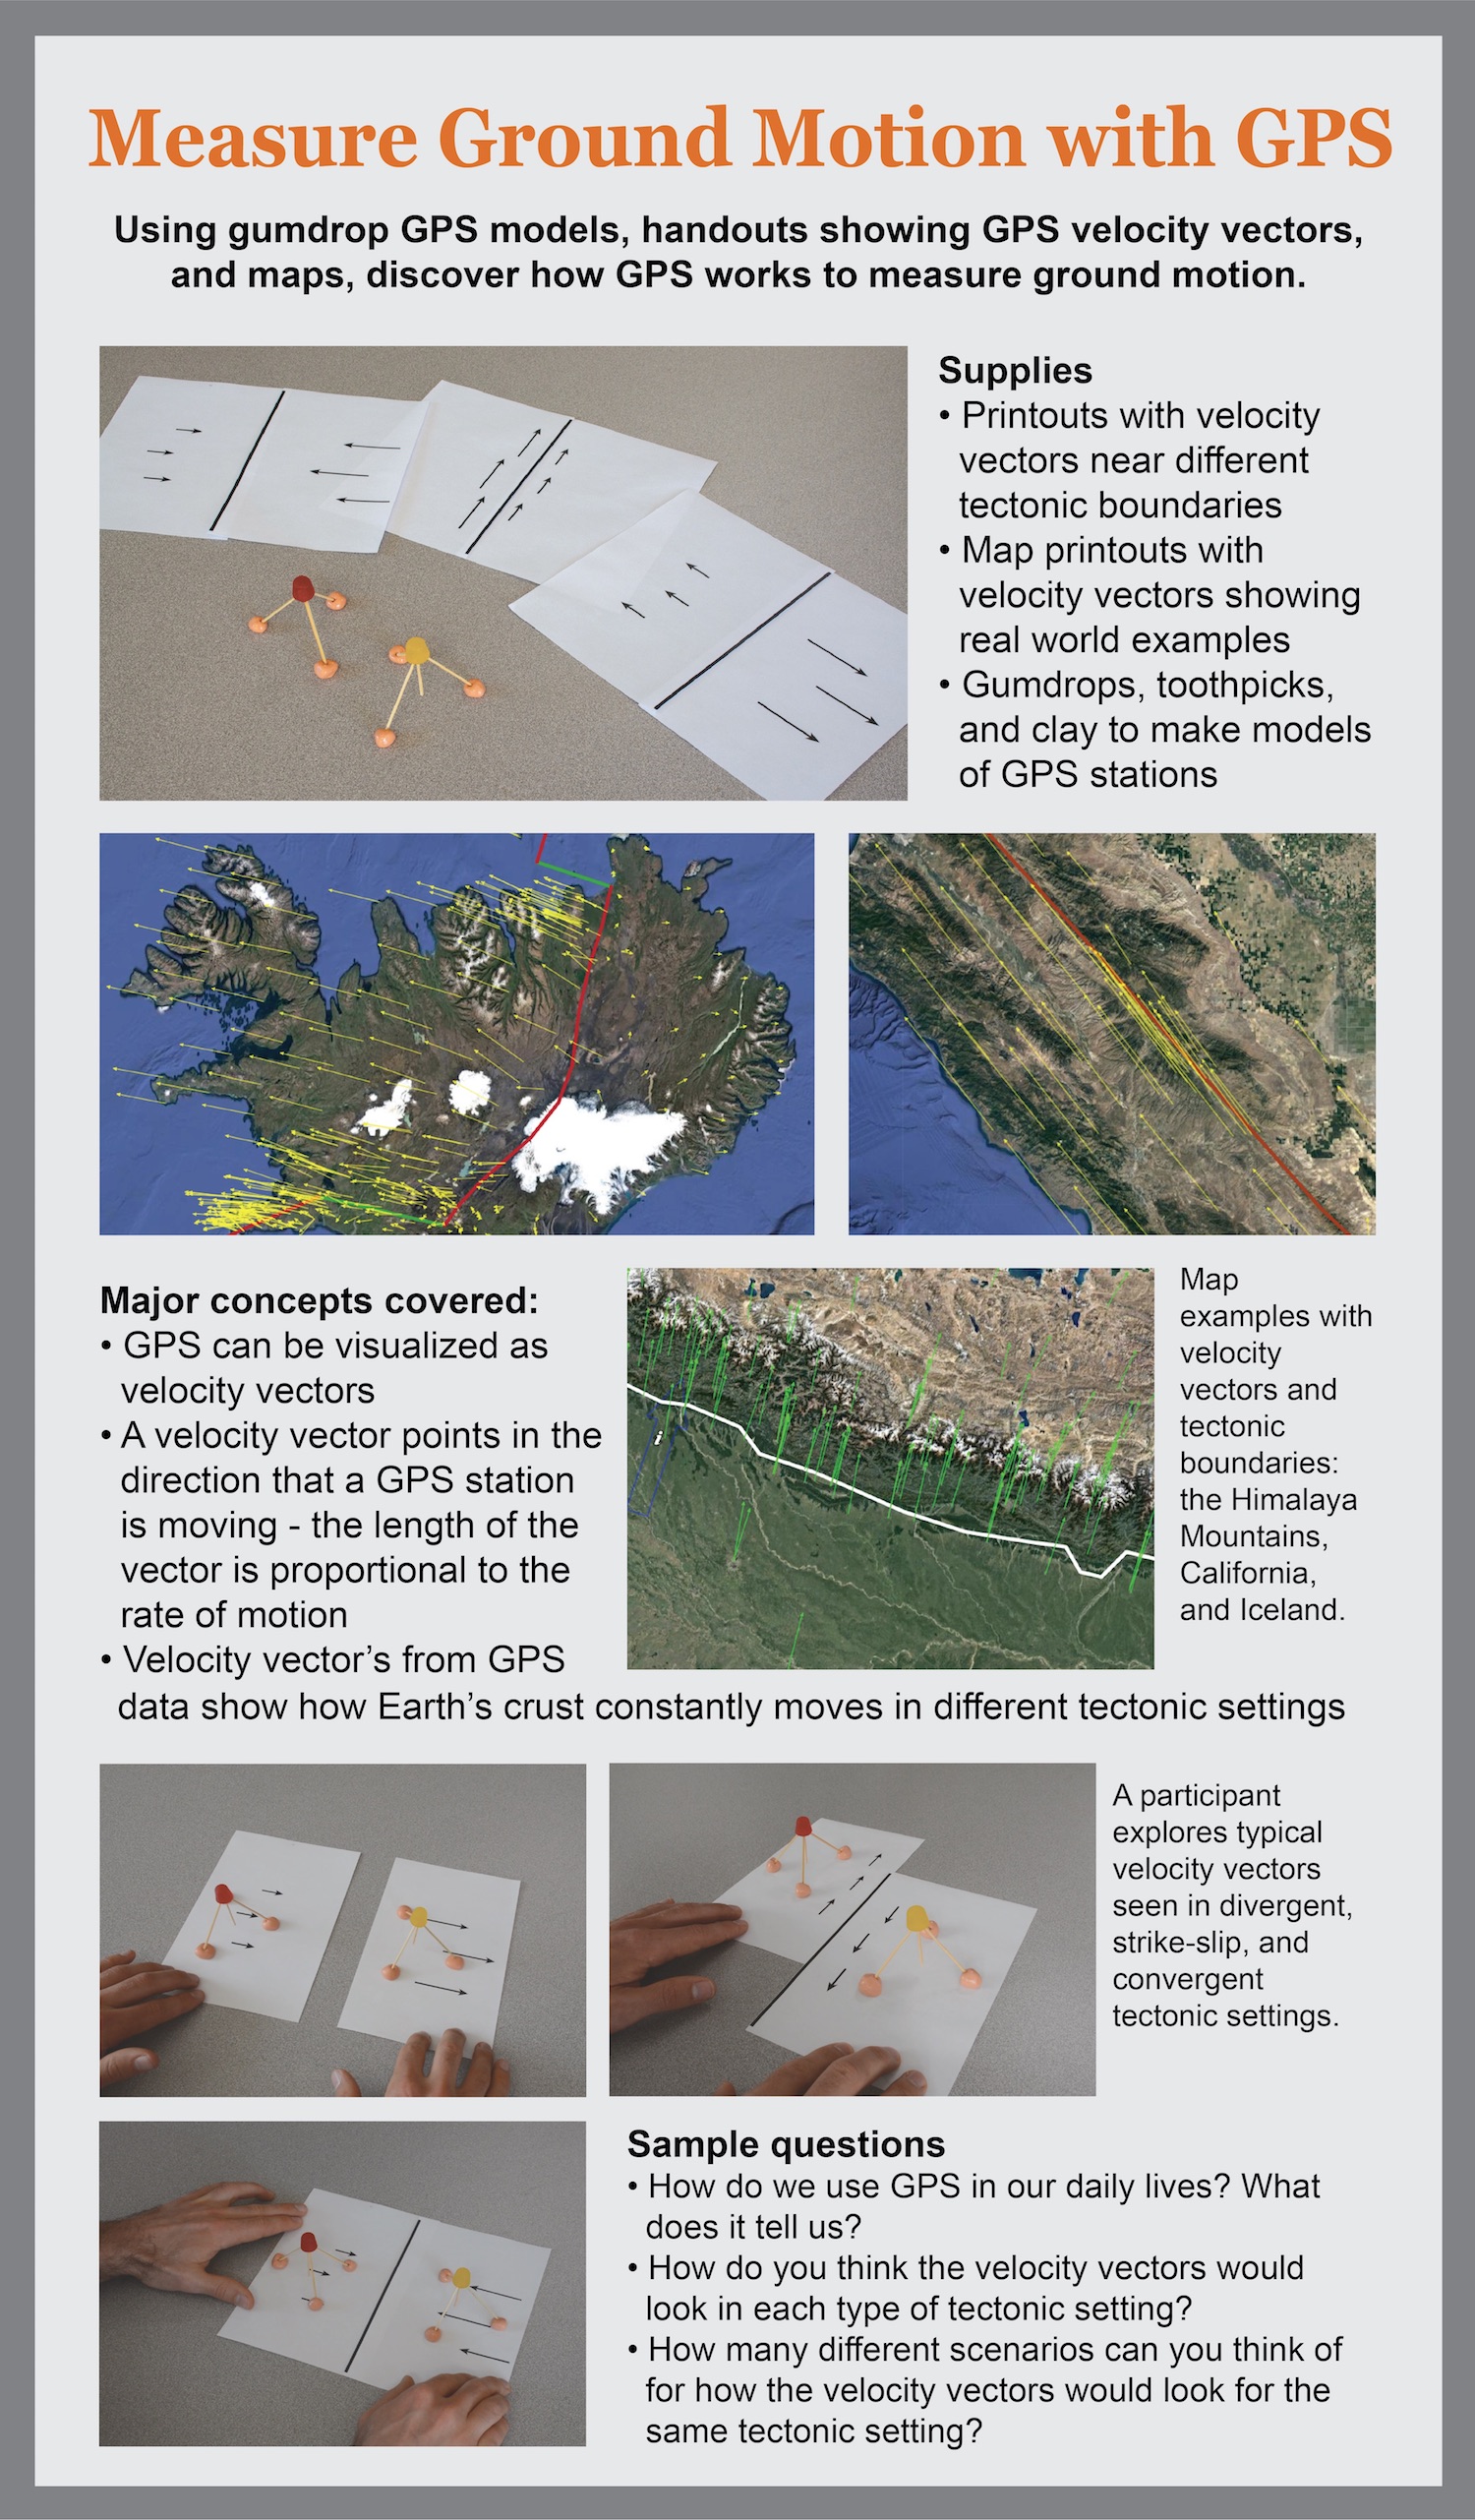
About the demonstration
With printouts of typical GPS velocity vectors found near different tectonic boundaries and models of a GPS station, demonstrate how GPS work to measure ground motion.
GPS velocity vectors point in the direction that a GPS station moves as the ground it is anchored to moves. The length of a velocity vector corresponds to the rate of motion. GPS velocity vectors thus provide useful information for how Earth's crust deforms in different tectonic settings.
Demonstration length
5 – 10 minutes for setup
10 – 15 minutes to demonstrateMajor concepts
- Earth's surface is constantly in motion.
- GPS can be visualized as velocity vectors.
- A velocity vector points in the direction that a GPS station is moving and its length is propotional to the rate of motion.
- Velocity vectors from GPS data show how Earth's crust moves in different tectonic settings.
Supplies
- Gumdrops, toothpicks, and clay (to make GPS models)
- Printouts showing velocity vectors near different tectonic boundaries (Supplementary Materials)
- Printouts of maps with velocity vectors showing real world examples (Supplementary Materials)
Instructions for assembly
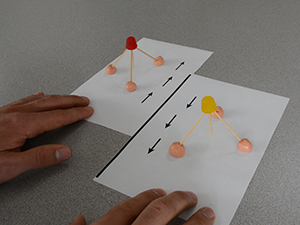
- Construct GPS models with the gumdrops, toothpicks, and clay.
- Cut the printouts of the velocity vectors and map examples along the tectonic boundaries.
Leading the demonstration
- Describe the parts of the demonstration:
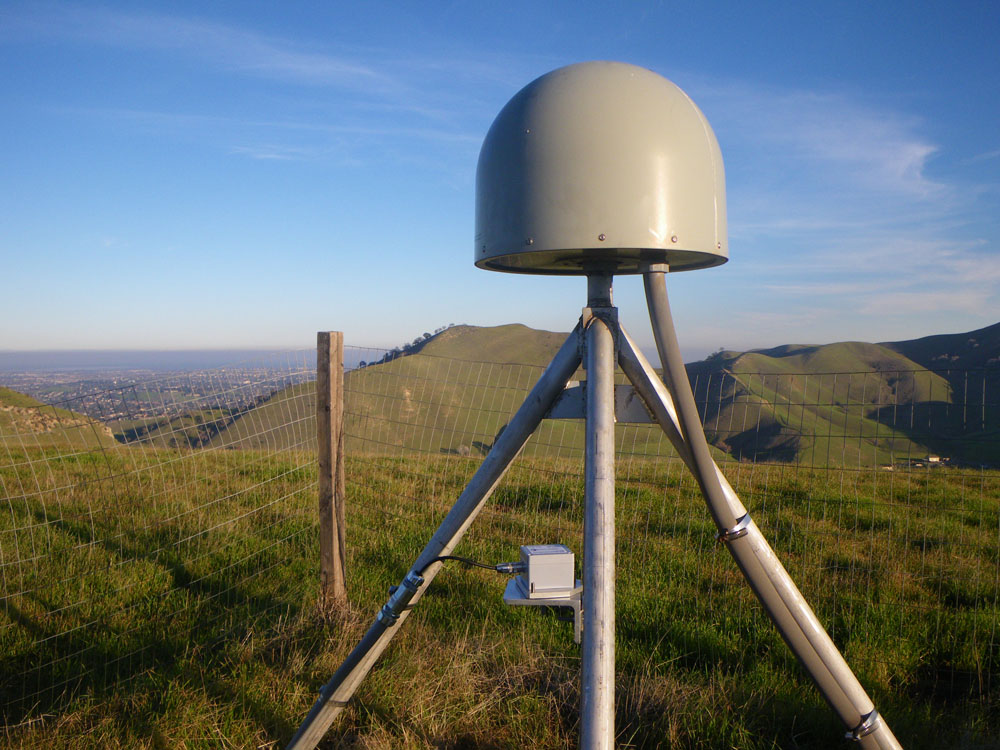
- With the GPS model, the gumdrop is the antenna and raydome, the toothpicks are the legs, and the clay is the cement.
- The tectonic boundary printouts are cut along the boundary. The velocity vectors on each side show how fast and in what direction it is moving.
- Discuss the basics of getting velocity vectors from GPS:
- GPS stations are firmly secured to the ground so that when the ground moves, the GPS station moves, too.
- Velocity vectors show the direction and how fast a GPS station is moving.
- Have participants explore how different velocity vectors relate to different tectonic settings. Note that you can either begin with the map examples and transition to the velocity vectors-only examples or vice versa.
Sample questions to consider
- How do we use GPS in our daily lives? What does it tell us?
- What are the different types of tectonic boundaries?
- How do you think the velocity vectors would look in each type of tectonic setting?
- How many different scenarios can you think of for how the velocity vectors would look for the same tectonic setting?
-
Helpful supplemental materials include:
-
Printouts of tectonic settings with velocity vectors:
-
Printouts of map examples:
Himalaya: Convergent boundary [PDF] [JPG]
Himalaya: Convergent boundary with drawn boundary [PDF] [JPG]
Iceland: Divergent boundary [PDF] [JPG]
Iceland: Divergent boundary with drawn boundary [PDF] [JPG]
California: Strike-slip boundary [PDF] [JPG]
California: Strike-slip boundary with drawn boundary [PDF] [JPG] -
Picture of a GPS monument (below)
-
Complete lesson plans from UNAVCO's Modules & Activities where this demonstration could be used:
- Exploring tectonic motions using GPS velocity maps: Alask, Western U.S., and Around the World
- Measuring plate motion with GPS: Iceland
- Exploring plate motion and deformation in California with GPS
- Episodic tremor and slip: The Case of the Mystery Earthquakes
- Module: Detecting Cascadia’s Changing Shape with GPS
CREDITS
Demonstration developed by Shelley Olds.
Video produced by Daniel Zietlow. -
Printouts of tectonic settings with velocity vectors:
![[JPG]](/education/outreach/demonstrations/lib/images/convergent.jpg)
![[JPG]](/education/outreach/demonstrations/lib/images/divergent.jpg)
![[JPG]](/education/outreach/demonstrations/lib/images/strike-slip-A.jpg)
![[JPG]](/education/outreach/demonstrations/lib/images/strike-slip-B.jpg)
![[JPG]](/education/outreach/demonstrations/lib/images/convergent-himalaya.jpg)
![[JPG]](/education/outreach/demonstrations/lib/images/convergent-himalaya-boundary.jpg)
![[JPG]](/education/outreach/demonstrations/lib/images/divergent-iceland.jpg)
![[JPG]](/education/outreach/demonstrations/lib/images/divergent-iceland-boundary.jpg)
![[JPG]](/education/outreach/demonstrations/lib/images/strike-slip-california.jpg)
![[JPG]](/education/outreach/demonstrations/lib/images/strike-slip-california-boundary.jpg)
Last modified: 2019-12-24 01:26:00 America/Denver