
There’s one thing about tectonic plates that makes tracking their movement with GPS stations possible—they are slow. Collecting multiple position measurements over time shrinks the error bars and improves precision. But GPS (or multi-constellation GNSS) stations also have an important role to play in earthquake early warning systems, and here the luxury of time evaporates. Stations need to detect and help characterize an earthquake in a matter of seconds in order to assist in generating timely warnings.
Currently, this is done by applying real-time corrections to the data. This involves using estimates of current satellite positions and clock errors, along with calculations of the ionosphere’s impact on the satellite signal, to greatly improve precision to within a few centimeters. But there’s another way to approach this problem, and that’s to directly measure the station’s velocity as it moves during an earthquake—which has the advantage of working without relying on external correction information.
The basic principle is that when precise measurements of the oscillating satellite signal are made in rapid succession, most sources of measurement error (like atmospheric conditions or satellite positions) aren’t changing much between consecutive datapoints. Additionally, the velocity of an orbiting GPS satellite is predictable. So instead of calculating the station’s absolute position, you can simply calculate the apparent amount of position change—its velocity—based on the change in the signal. A motionless antenna will measure very little change, but a moving antenna will measure much more.
This technique can actually enable permanent GNSS stations to record earthquake shaking, as we described in another article.
So could this velocity data improve the performance of GNSS stations used for earthquake early warning? That would depend on how it compares to the use of real-time position corrections in practice. To evaluate this, a UNAVCO team led by Tim Dittmann, along with Jade Morton of the University of Colorado Boulder, applied it to high-rate data from the Network of the Americas. The study is published in Seismological Research Letters.
The analysis used 250 stations in the vicinity of the 2019 M7.1 Ridgecrest earthquake, and for a very different test, two stations in the vicinity of the 2021 M5.3 Calipatria earthquake. Using a day’s worth of raw data at almost 600 stations, the team also calculated average variability (or “noise”) in both position and velocity data and related this to expected peak seismic signals for earthquakes of different magnitudes and distances.
The greater the variability, the stronger the earthquake signal would have to be in order to be detectable—this “noise floor” determines how sensitive the stations are to the events we’re interested in. In the analysis, that noise floor was about 2.5 centimeters for positions and about 0.01 meters per second for velocities. That means peak ground displacements or peak ground velocities greater than those numbers would be flagged as a possible earthquake.
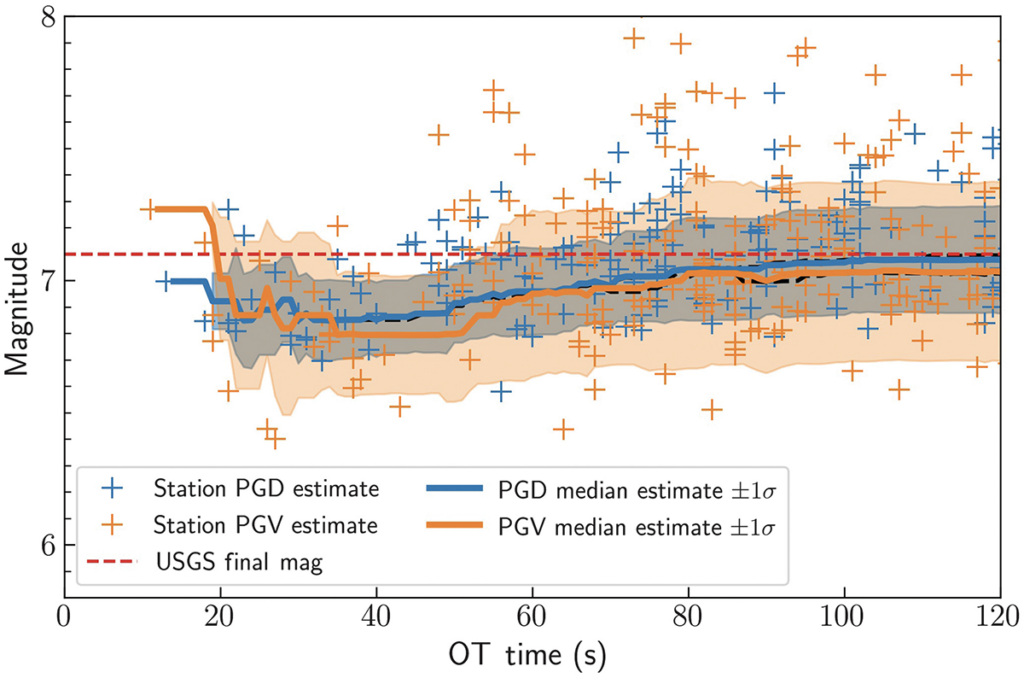
Applying this to the two example earthquakes, displacement calculations estimated the Ridgecrest earthquake magnitude within 0.2 of the final M7.1 determination in under 20 seconds—as did the velocity data, though with slightly larger error bars.
But for the much smaller M5.3 Calipatria earthquake with just two stations in the vicinity to provide data, the velocity signal cleared the noise floor at both stations—the displacement signal only rose above the noise floor at one station.
The team concluded that the velocity data is more sensitive for weaker (or distant) earthquakes, though this advantage decreases for the largest, nearby events. And because this technique doesn’t require constant inputs for corrections, it could easily be processed on devices inside each station at even higher sampling rates. That would be appealing for experiments with closely spaced arrays of less expensive instruments, for example. This velocity-based geodetic processing technique is complementary to existing approaches to characterize earthquake motions and further blurs the line between traditional geodesy and seismology.
Written by:
- Scott K. Johnson
- Posted: 28 March 2022
- Last updated: 28 March 2022
- Tags: ShakeAlert
-

