
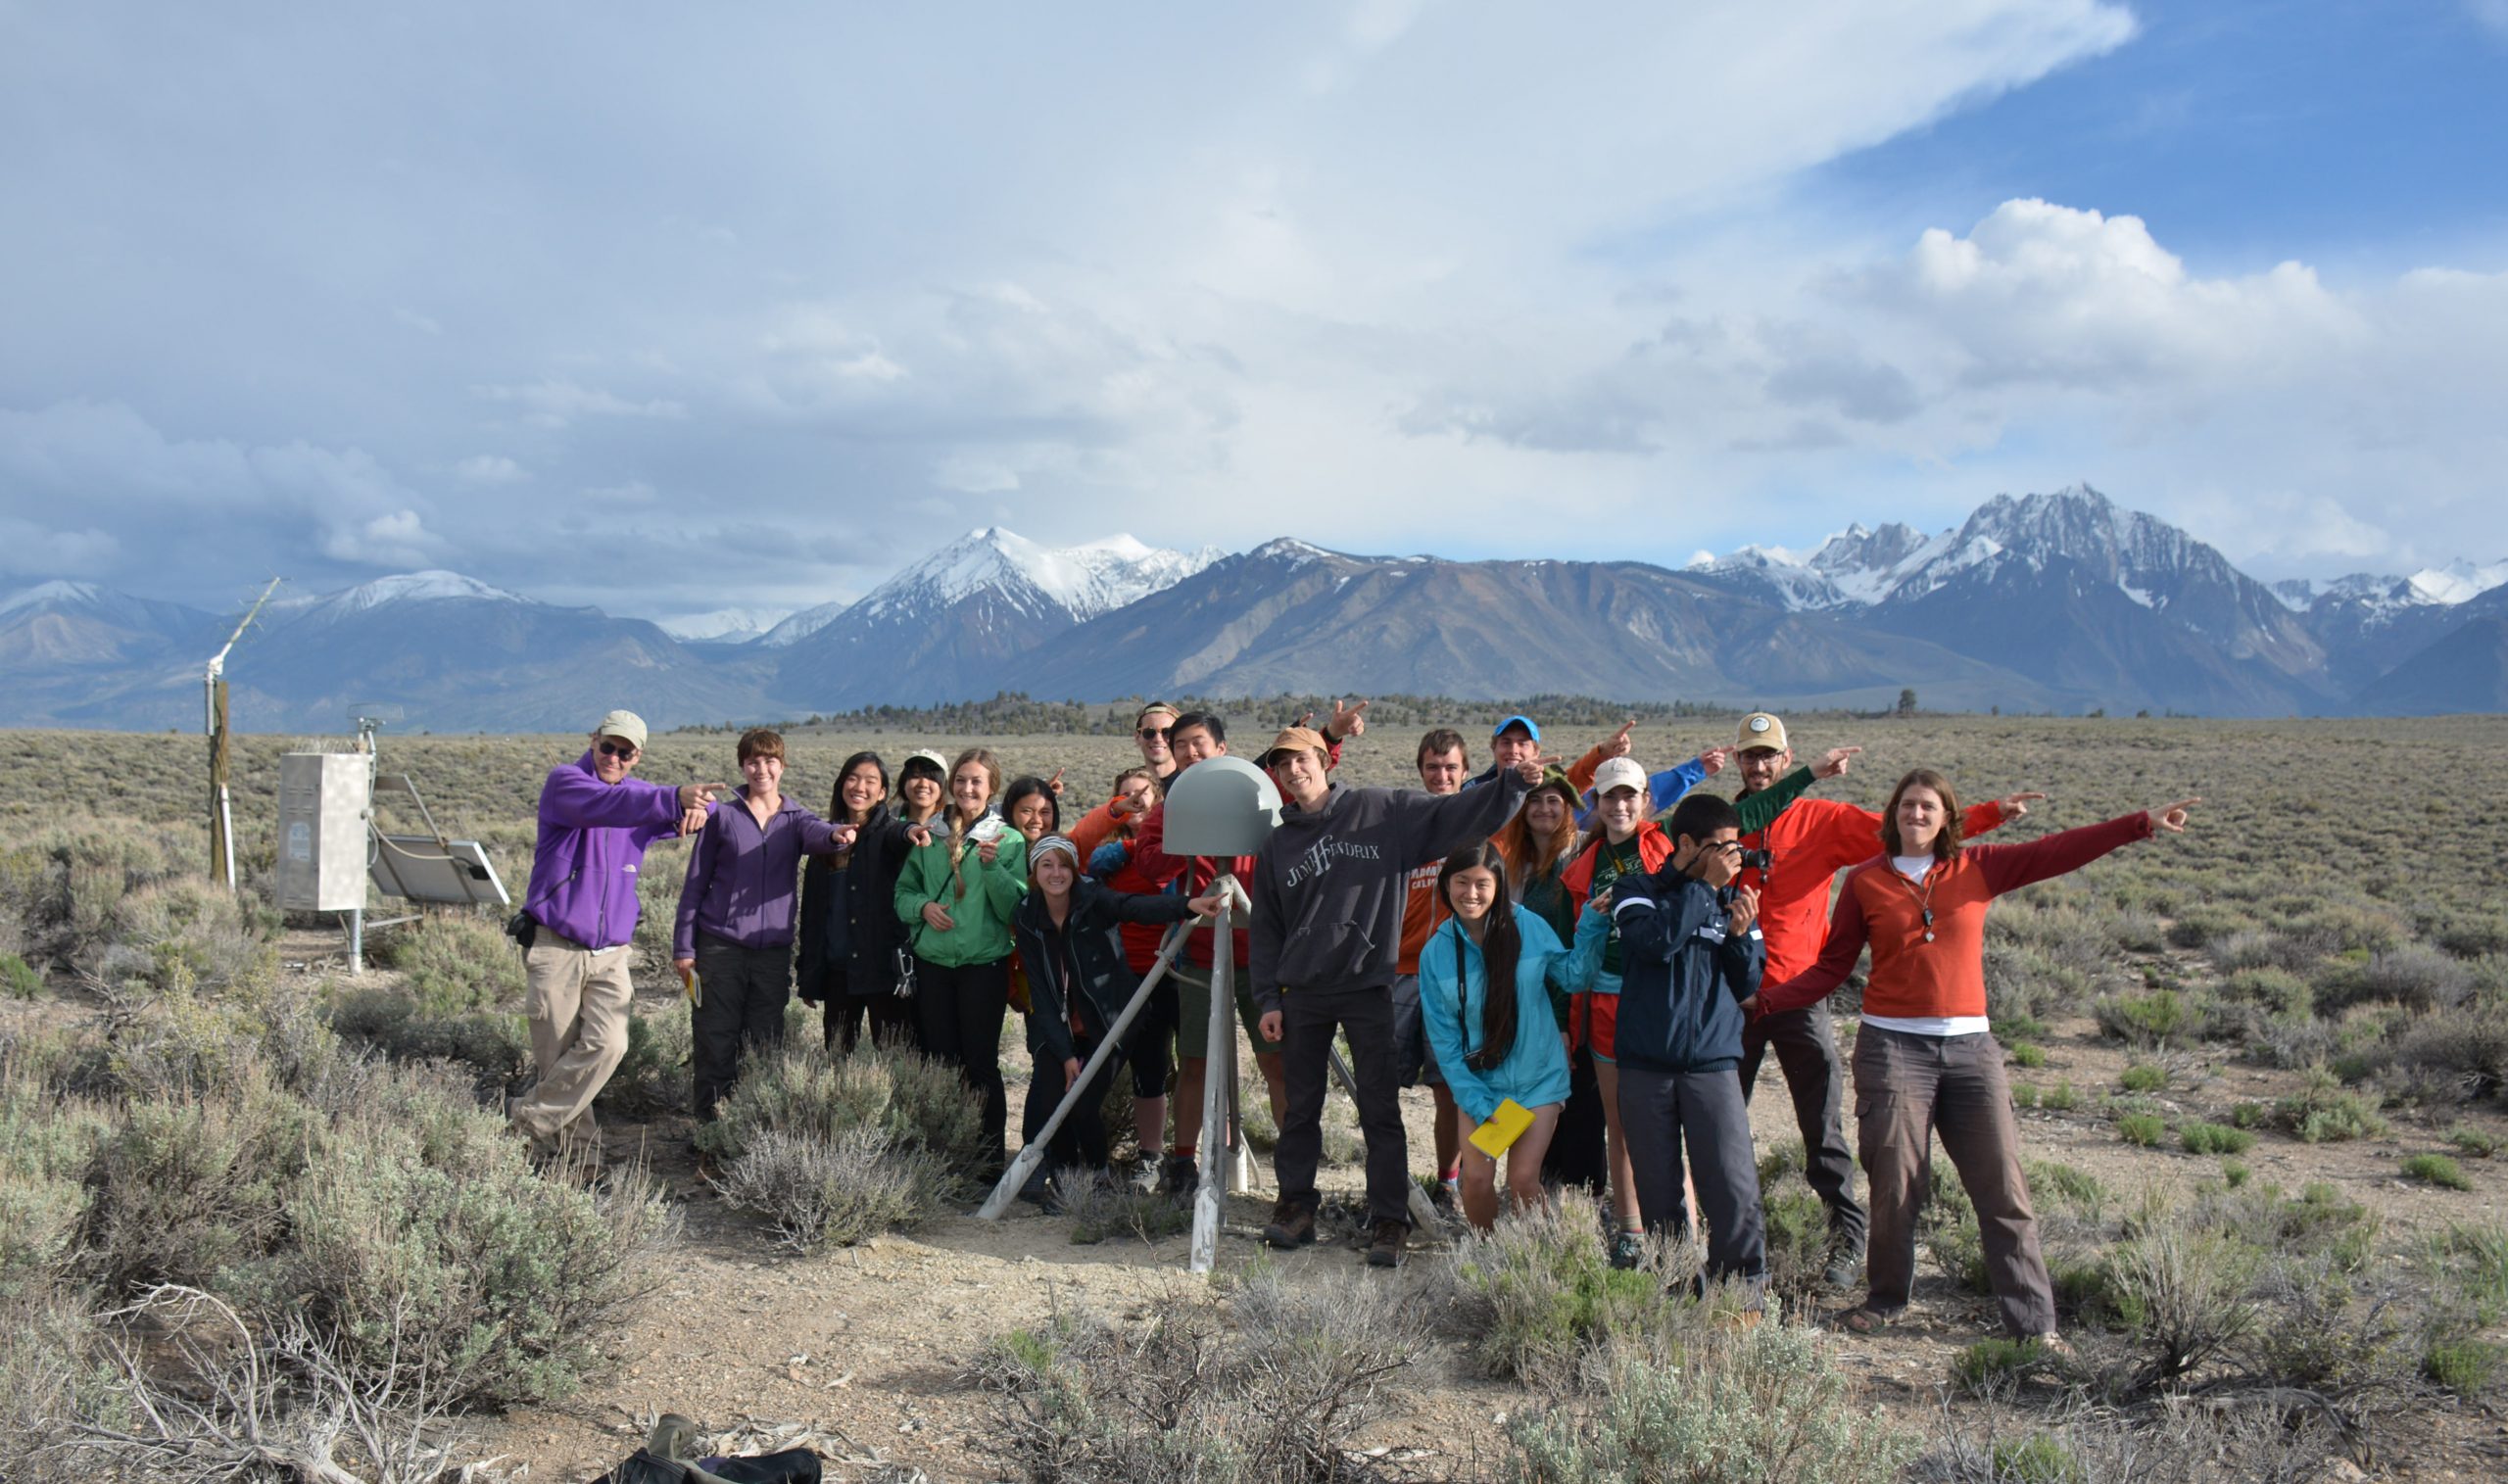
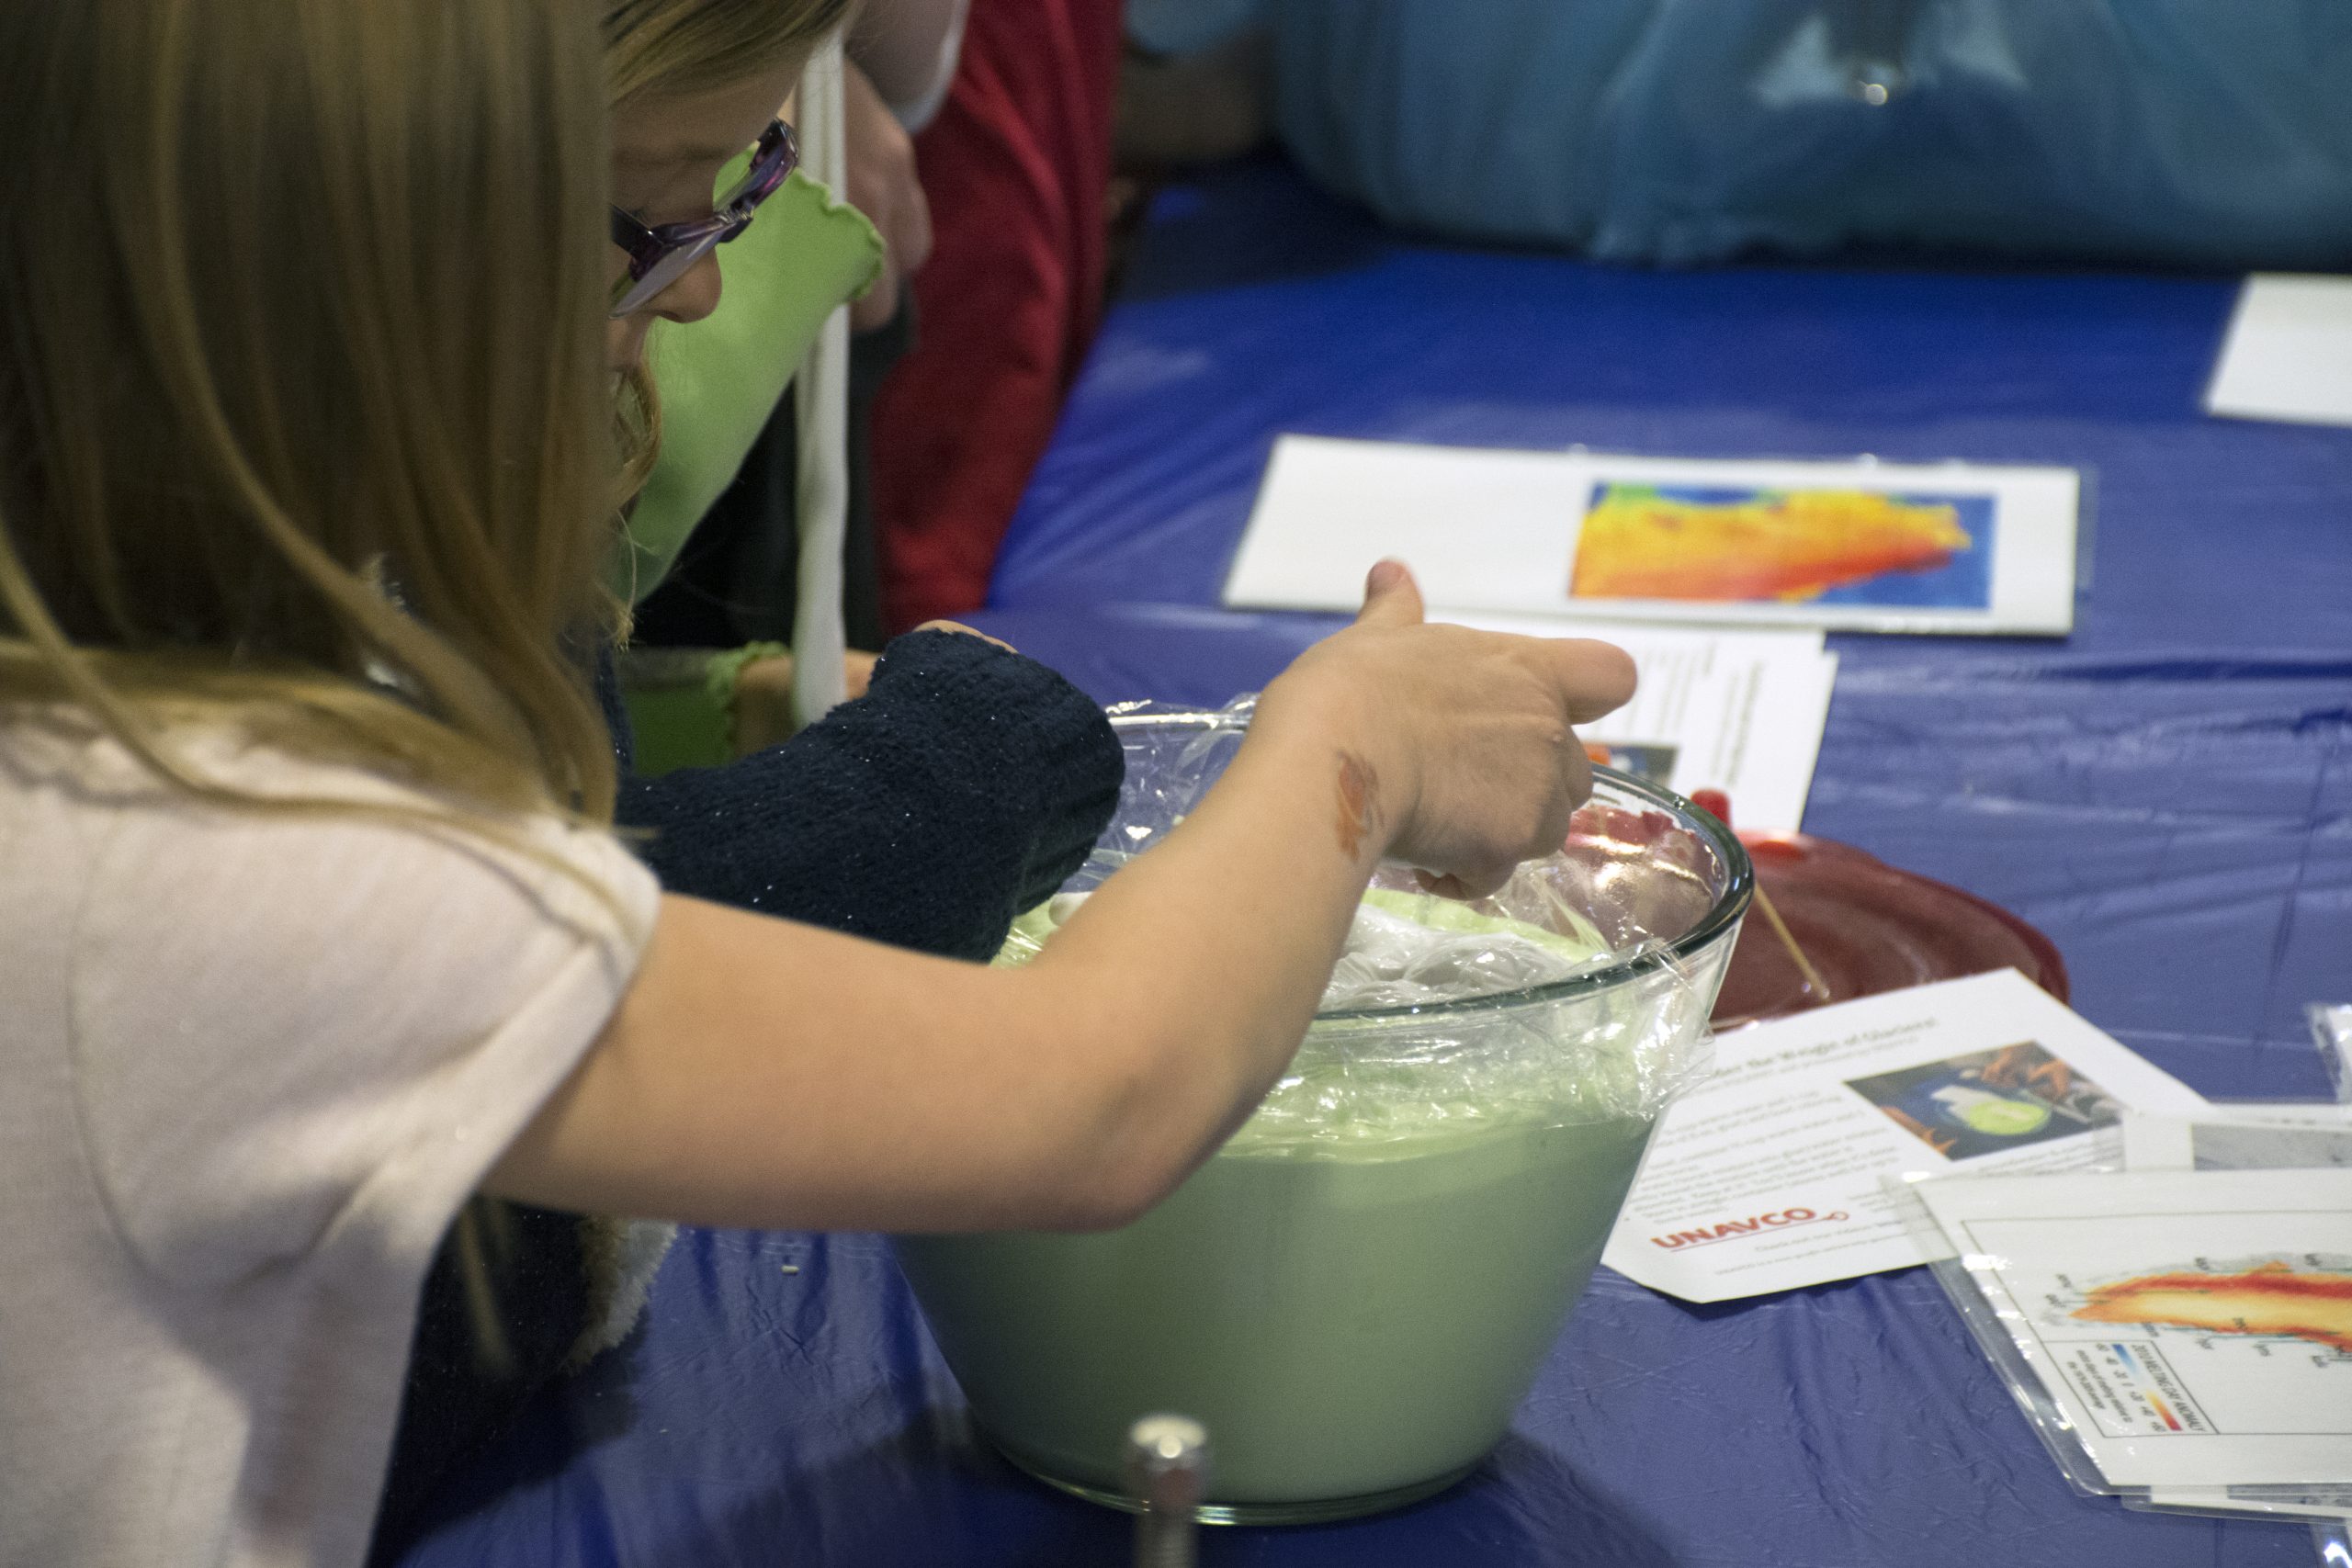
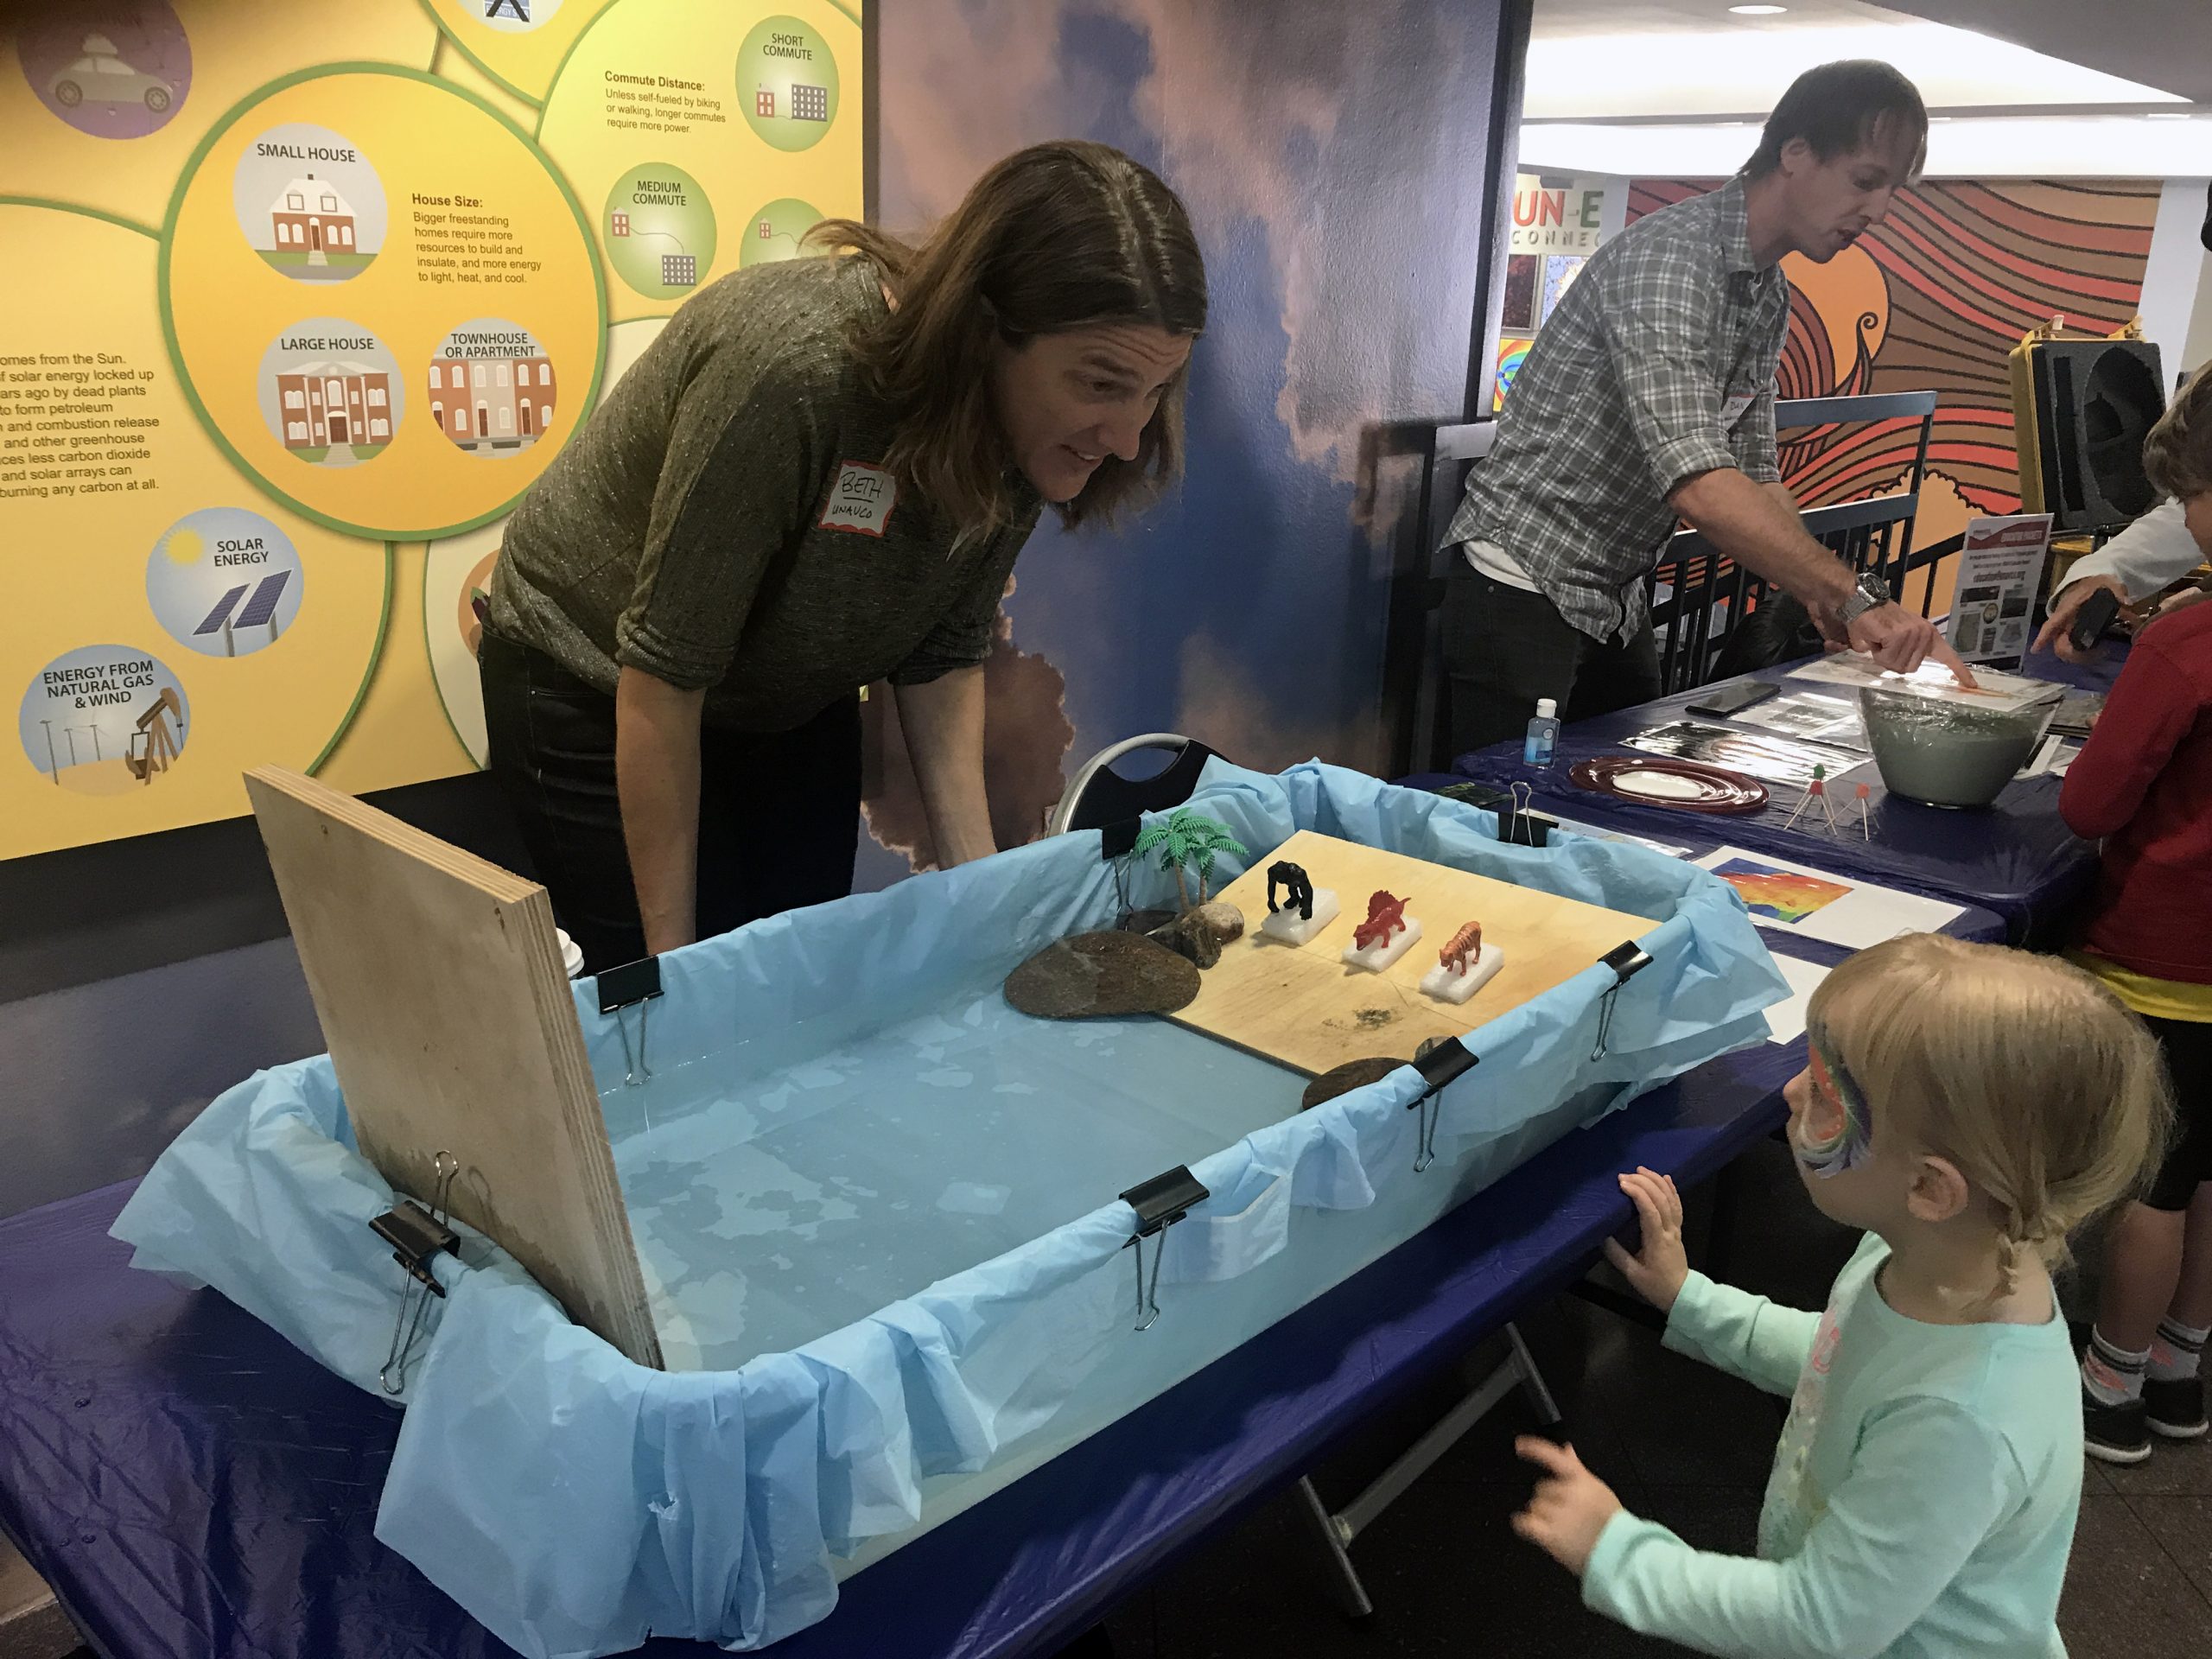
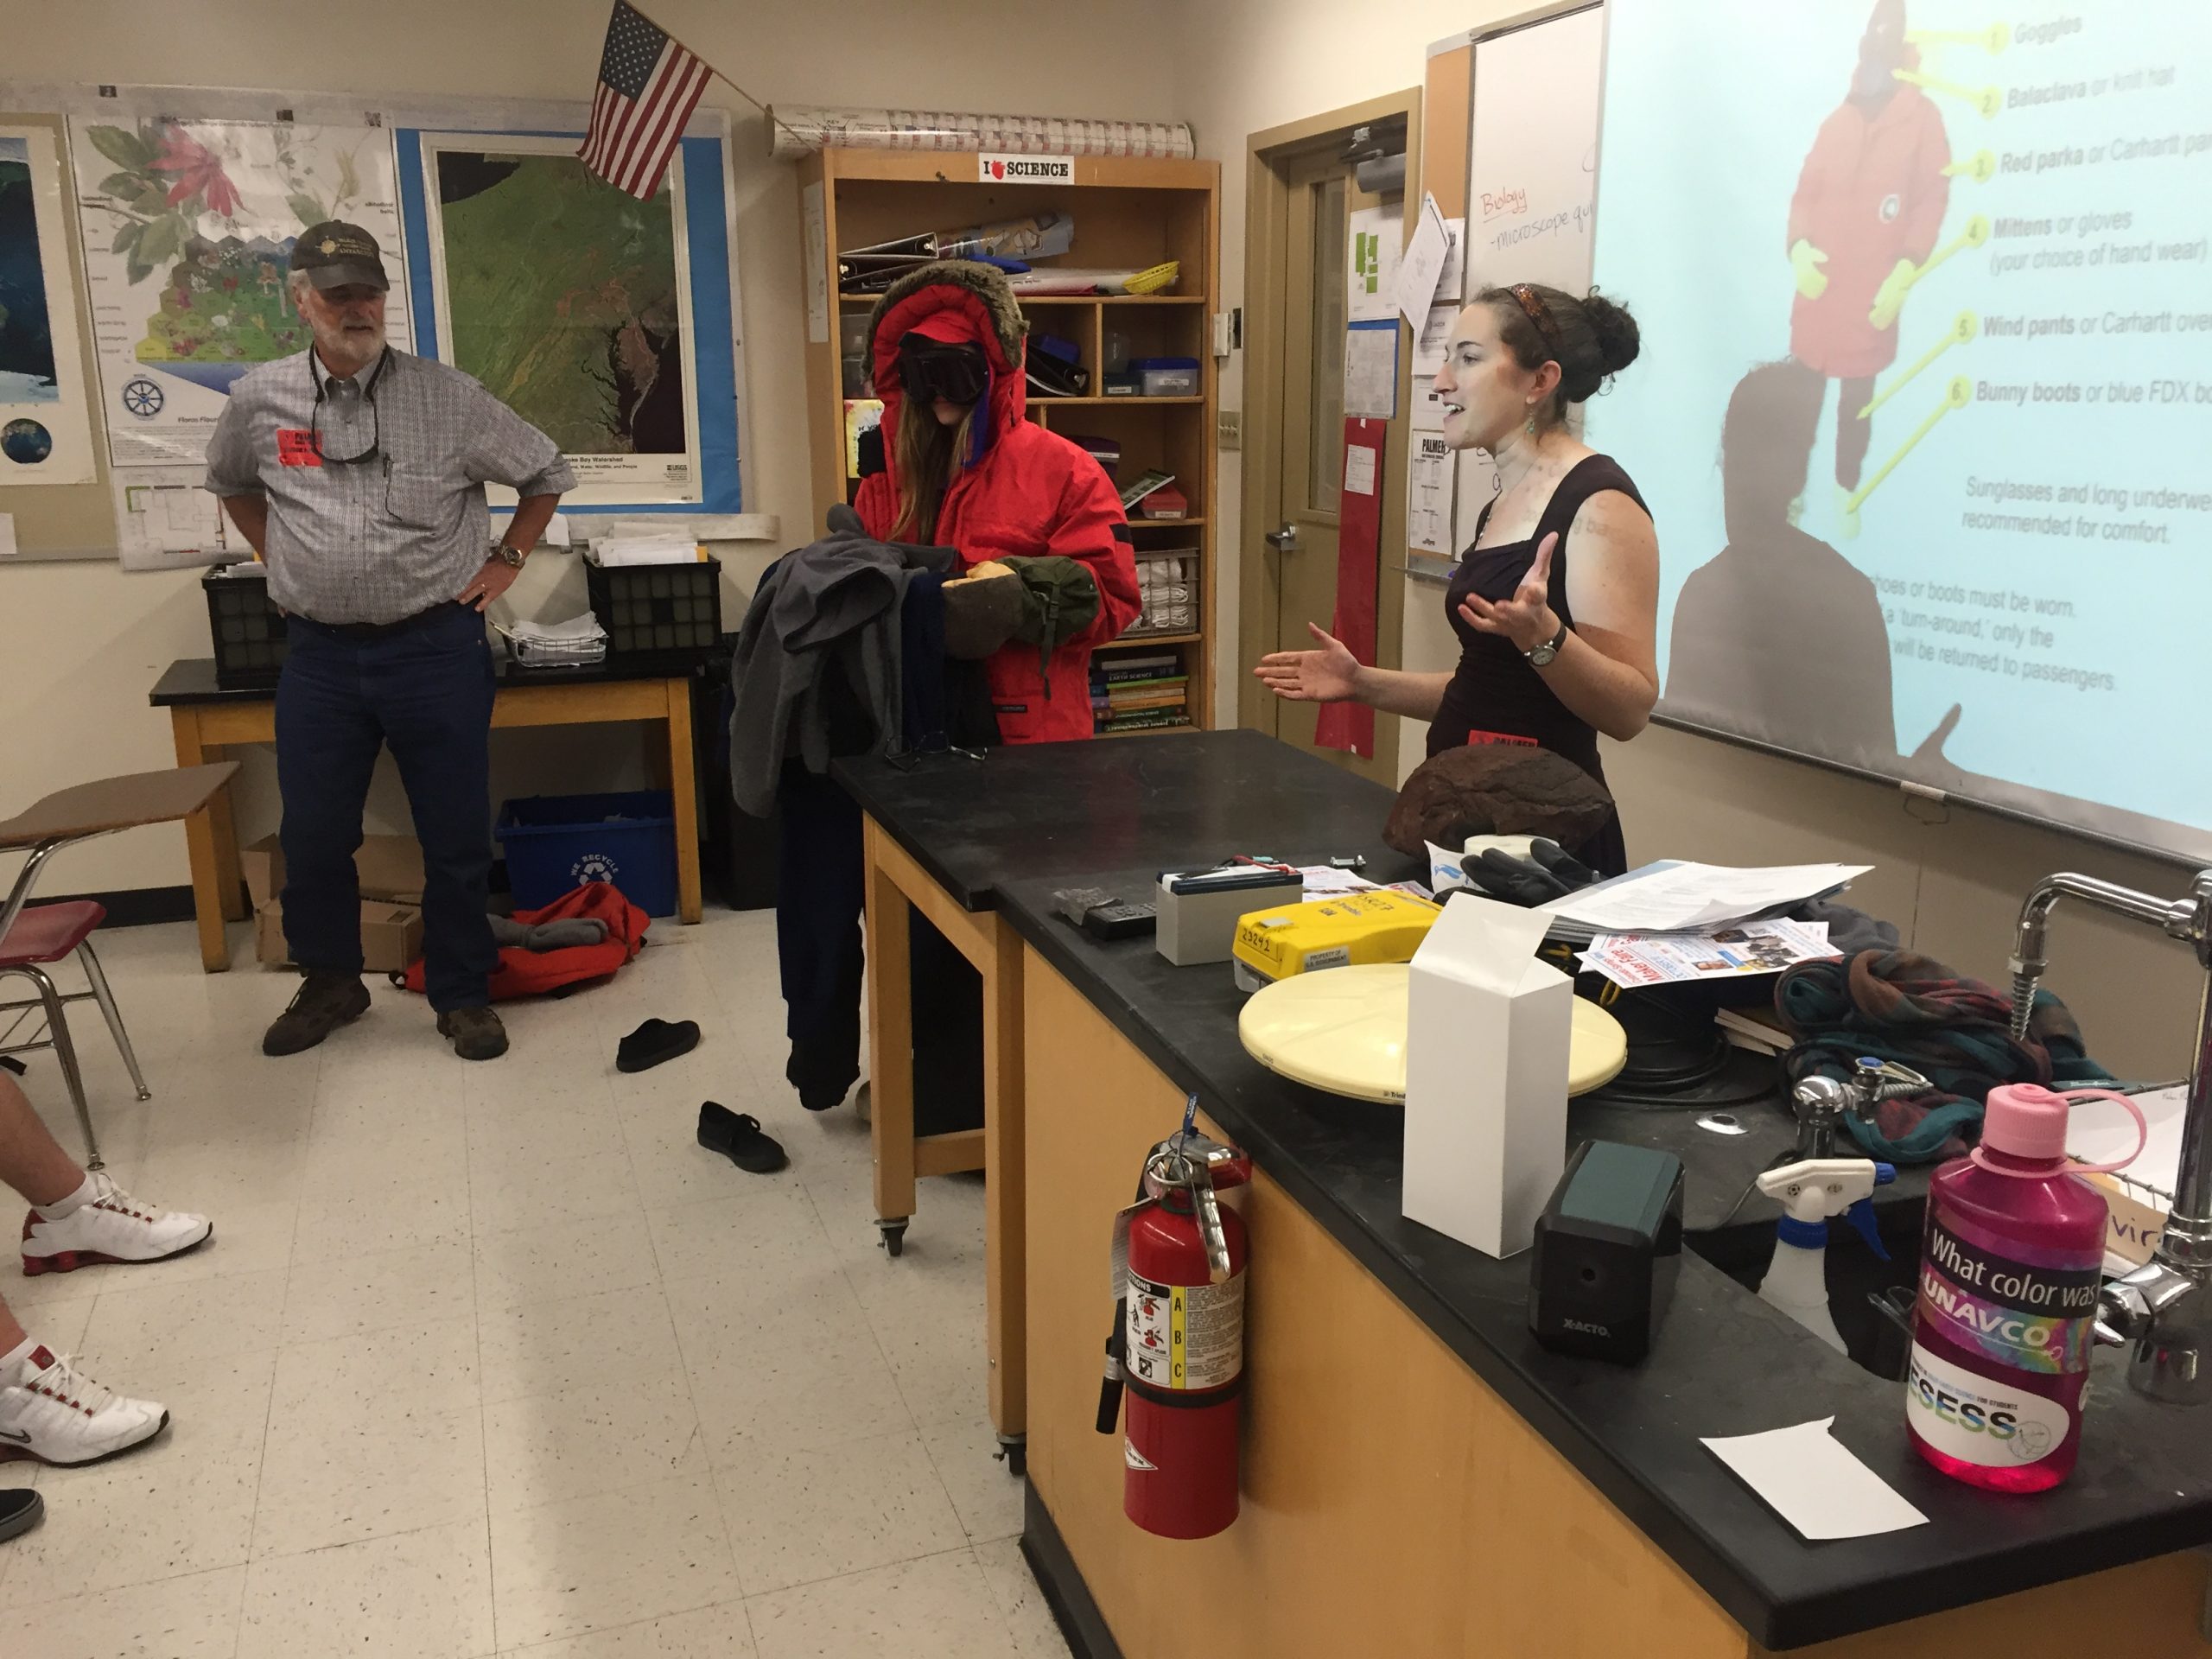
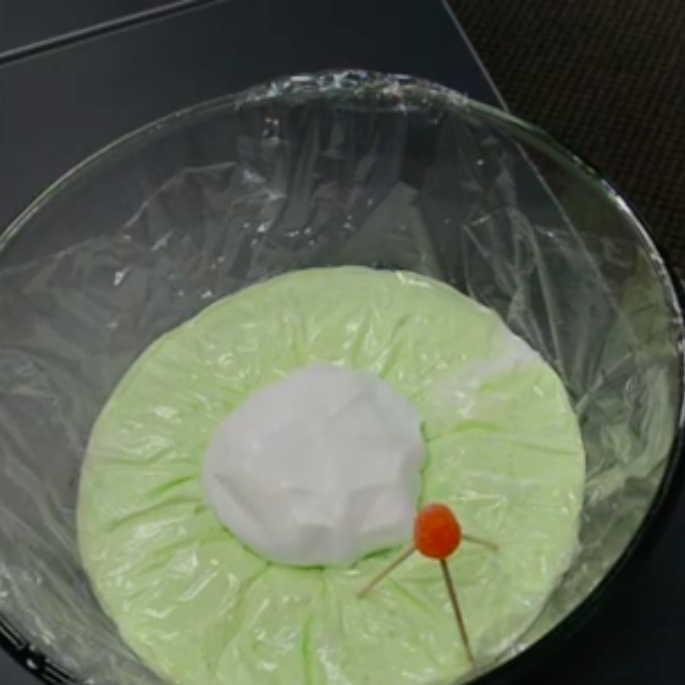
Looking for resources that use data and modern teaching techniques to use in your teaching or after-school program? Utilize our hands-on demonstrations, videos, animations, graphics, and other resources to incite your students’ curiosity about geoscience. Explore your world with your students.
Home
Additional Resources
Seismology resources
EarthScope also provides a variety of educational resources for seismology (including animations, posters, and demonstrations) for levels ranging from novice to expert.
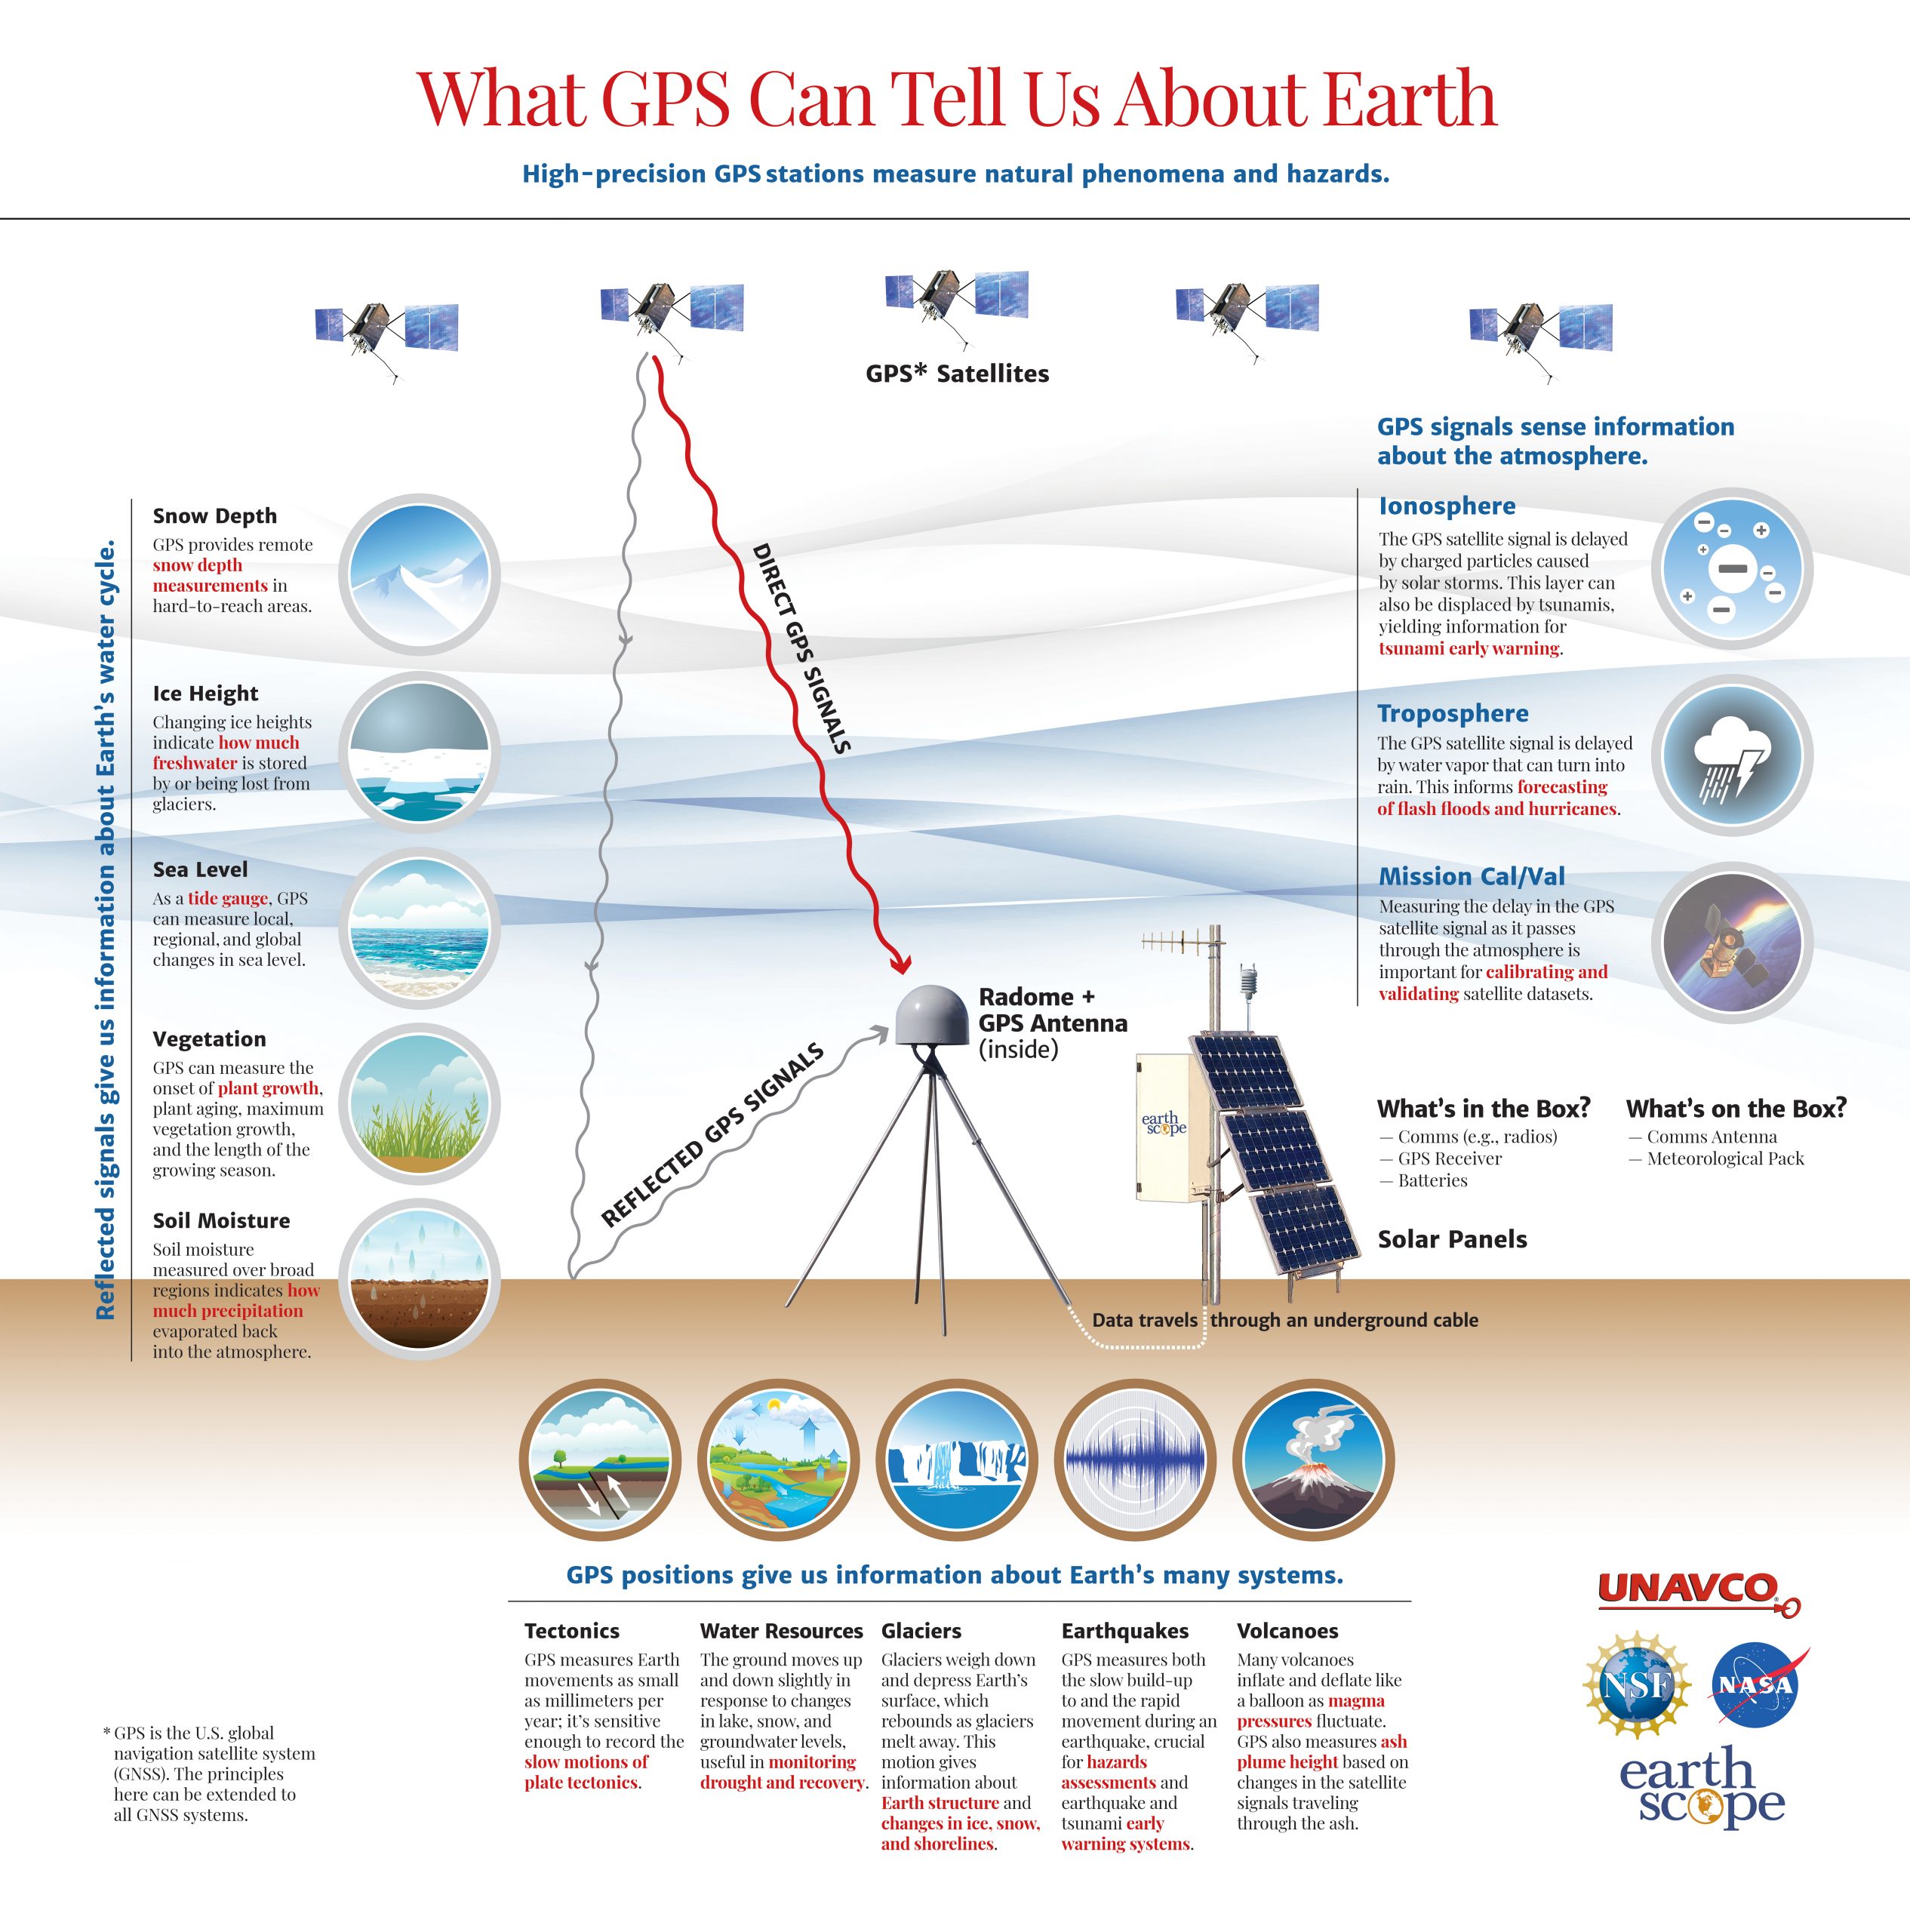
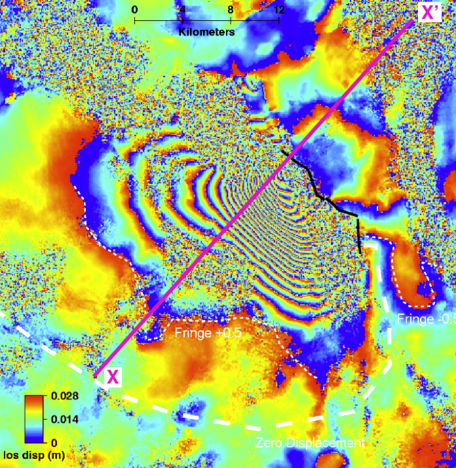
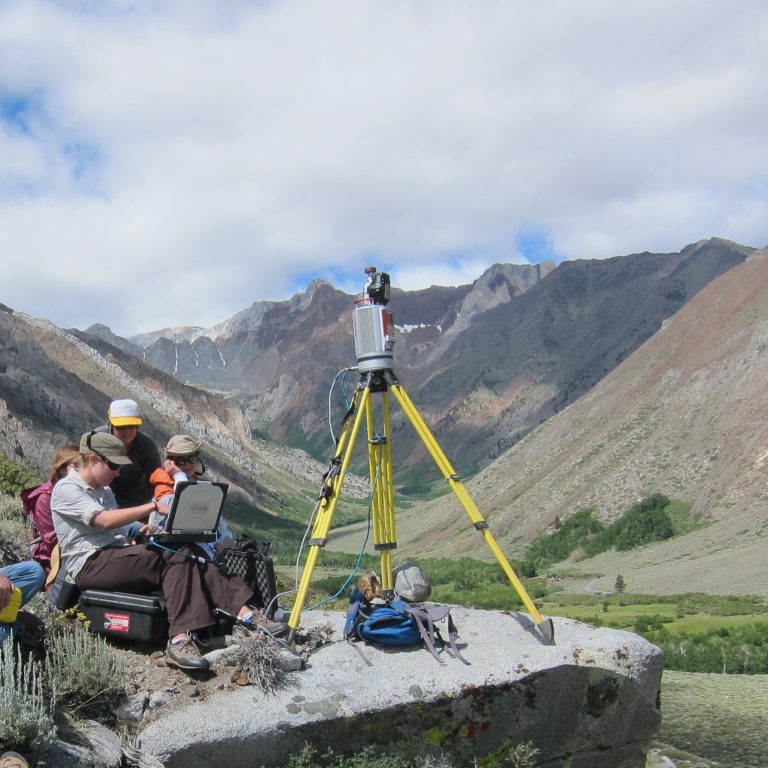
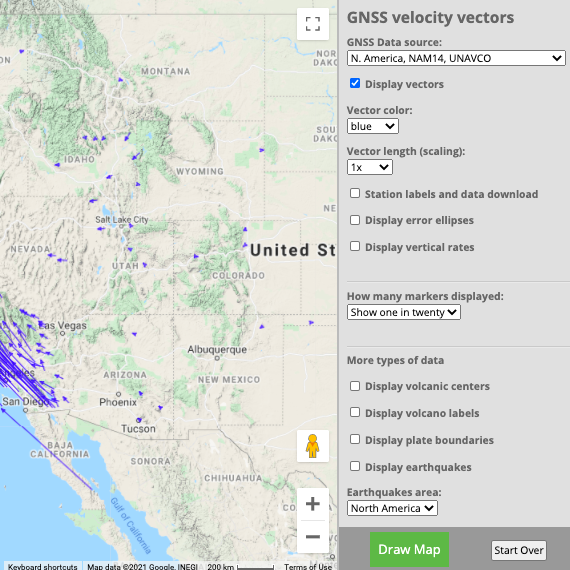
GPS Spotlight
The GPS Spotlight website contains guides explaining how GPS works and examples of science powered by a specific GPS stations around the world.