)
Geophysical Event Response Data Explainer: Dynamic Strain
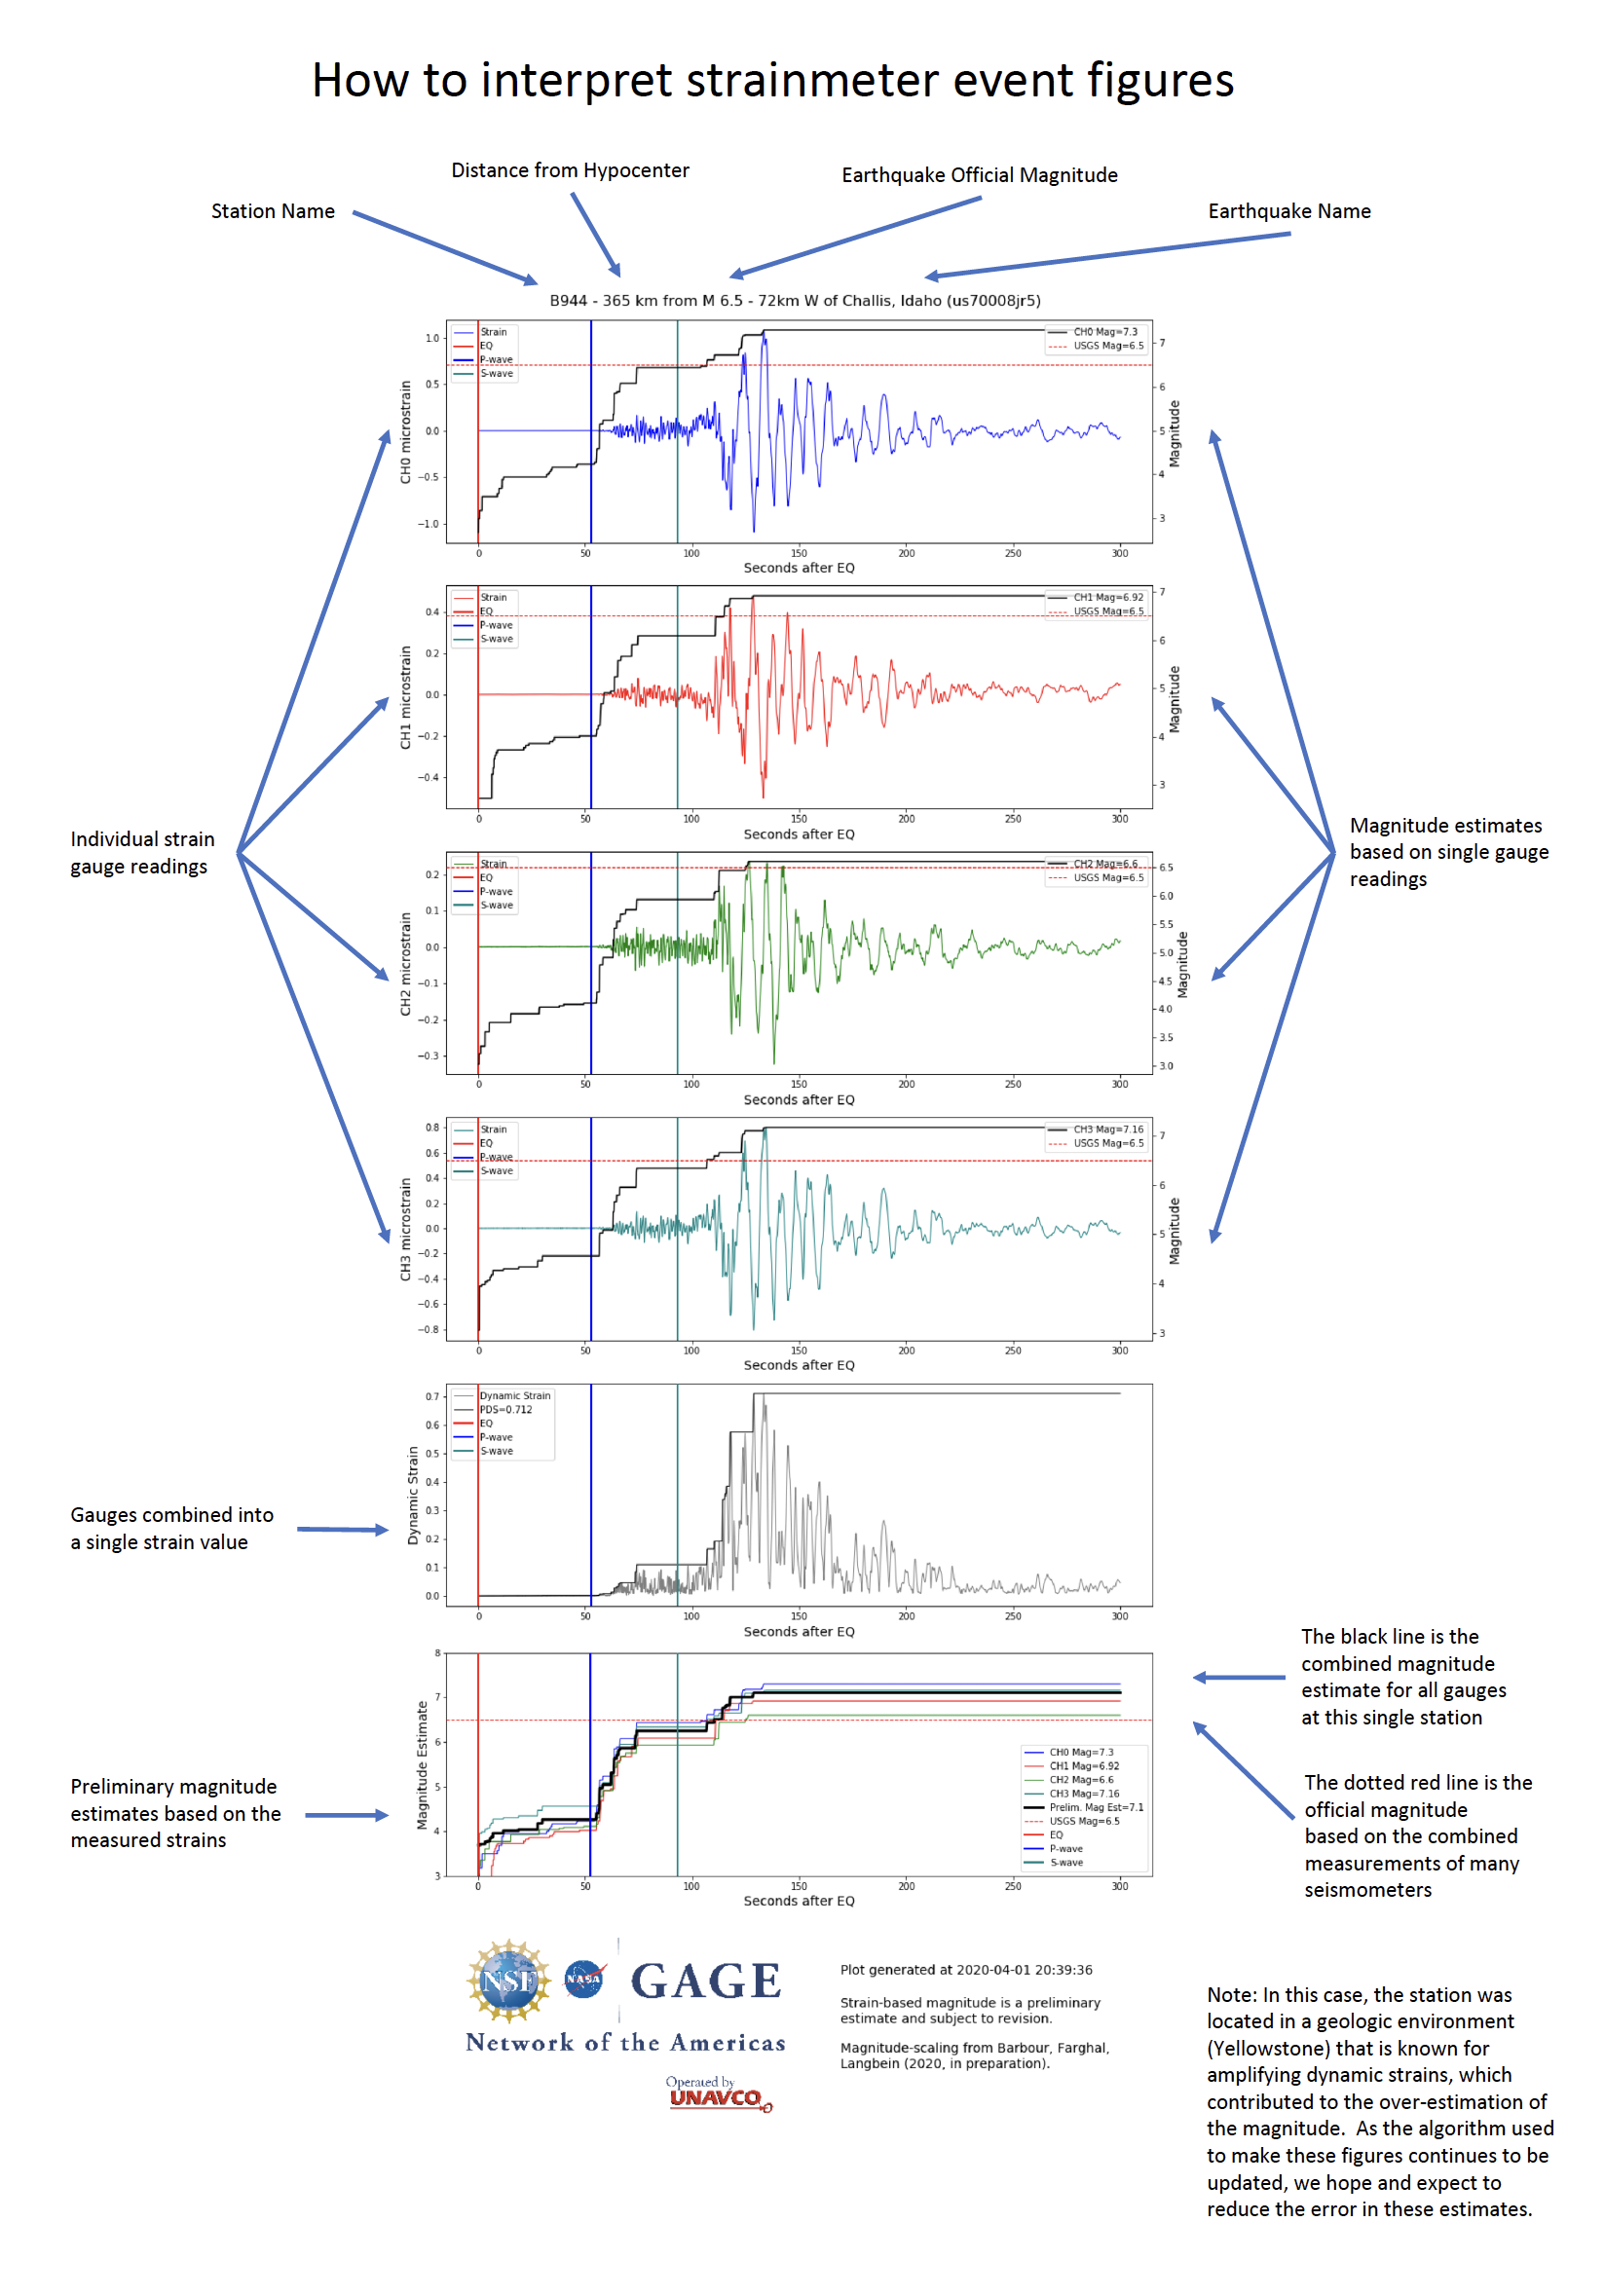
Dynamic Strain: Annotated Example
Our Geophysical Event Response Data Explainers are intended to help visitors understand the products GAGE generates automatically for events such as earthquakes. The work is done in support of the National Science Foundation Geodetic Facility for the Advancement of Geoscience.
What do these plots mean?
This is data from a borehole strainmeter, an instrument about 2.5 meters* in length installed vertically anywhere from 100 m to 250 m deep, with four separate strain sensors. That's why, even though it's one instrument, there are multiple strain measurements for each location.
Each sensor records strain, or its change in shape, in a different horizontal direction. The wiggles in this figure show the borehole expanding and contracting or shearing as the seismic waves pass through it. These graphs are a lot like what we see from seismographs--but instead of recording up and down or back and forth motion, they are recording small changes in the diameter of the borehole. The sensors are extremely sensitive; each one is a horizontal strain gauge that can measure changes in its diameter of less than the width of a hydrogen atom.
There's a lot we can learn from these, including what direction the earthquake came from and potentially the magnitude of the event. While seismometers have been used for decades to measure earthquake magnitudes, it is only in the last few years that scientists have begun to look at using strainmeters as a complementary tool for this purpose.
The magnitude estimates are shown as a black line on each plot; you can see how the estimate changes over time as more data is available. These magnitude estimates are based on recent work, still under revision, by A. Barbour, N. Farghal, and J. Langbein at the USGS (their work builds on the work of Barbour and Crowell, 2017). The magnitudes are therefore very preliminary, and included simply as an example of the type of work currently being done with these instruments. These estimates will likely continue to improve as the model is published, further refined, and updated.
It should also be noted that the official magnitude is calculated using the combination of measurements from many seismometer stations, while the strainmeter plots presented here are showing measurements from single stations and not network averages.
Hypocenter = 3D location of the earthquake's origin, including its depth (epicenter = the earthquake's horizontal location of origin, or its origin projected up onto the earth's surface).
* 2.5 meters = 8 feet; 100 m to 250 m = 330 ft to 820 ft
Reference: Barbour, A. J., and B. W. Crowell (2017), Dynamic strains for earthquake source characterization, Seismological Research Letters, 88(2A), 354–370.
Last modified: 2026-05-28 09:22:23 America/Denver