
Weather satellites track hurricanes through a number of different types of measurements but all things have strengths and weaknesses. And when it comes to severe weather, there’s no such thing as too much data for improving forecasts. Believe it or not, GPS stations may be able to help.
Separately from weather satellites, GPS stations (and GNSS stations that can use more networks of navigation satellites) can measure atmospheric water vapor. That’s because the signal from the navigation satellite to the ground station is delayed by water vapor—the greater the amount of water vapor, the greater the delay in arrival. Calculating GPS locations accurately requires extremely precise clocks, so this delay can be calculated to back out changes in atmospheric water vapor over time.
Water vapor is the fuel that drives tropical cyclones, releasing latent heat into the storm as it rises and condenses. The amount of water vapor ahead of a hurricane, then, is relevant to its behavior in the immediate future. While permanent GPS stations are located on land, they could provide additional information about water vapor in the area where a storm might make landfall.
To test this, a team led by Yohannes Getachew Ejigu at the Ethiopian Space Science and Technology Institute calculated water vapor estimates from 922 GPS stations split between the areas affected by hurricanes Harvey and Irma in 2017. In 6-hour timesteps, they tracked the location of maximum water vapor and each hurricane’s path.
First, they compared the maps of water vapor estimates to satellite-measured precipitation for each day throughout the storm’s approach and passage. The results matched quite well, showing that GPS-derived water vapor was accurate and relevant across the area affected by the storm.
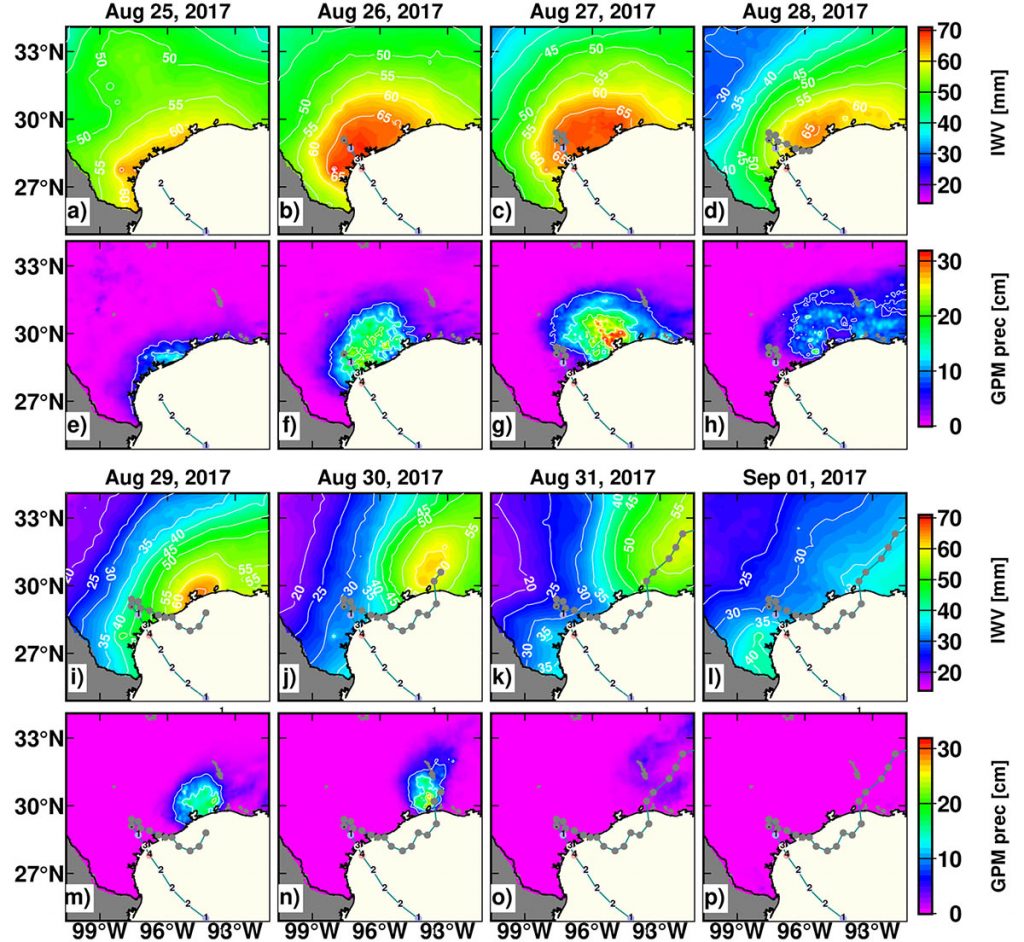
Looking at the storm track, each maximum water vapor location turned out to be a good prediction of the storm’s overland movement in the next 6-hour timestep. The land-based data could not predict Hurricane Harvey’s move offshore before its second landfall, but the direction of movement and the location of that landfall were accurate.
These results, the researchers say, “demonstrate that the use of [GPS-derived water vapor] could advance the preliminary monitoring of hurricane activity in regions such as the Gulf and East Coasts of the USA and the Gulf of Mexico, where dense arrays of GPS stations are available.”
This is less relevant to forecasts made several days out, of course, but incorporating GPS-derived water vapor data into the models can contribute to accurate short-term forecasts of storm track, intensity, and rainfall. Another source of data means a more complete picture of the atmospheric reality around the storm—and that can only help.
This study was published in GPS Solutions.
Written by:
- Scott K. Johnson
- Posted: 8 April 2021
- Last updated: 30 April 2021
- Tags: atmosphere, GPS/GNSS
-

