Notice: The UNAVCO IDV is no longer supported. You are welcome to download the UNAVCO IDV, but UNAVCO cannot help with any problems that are encountered with its installation or use.
The UNAVCO IDV (Integrated Data Viewer) is a software package for exploration and visualization of Earth-located geoscience data. Very often the IDV is the best way to discover and see the details of 3D Earth-located science data.
The IDV is designed to promote effective investigation and understanding of modern, complex, high volume geoscience data. With modern data sets, simple maps and tables of numbers hide rather than reveal important details of Earth structure. Clear and simple illustrations are essential to present conclusions, but to explore and find meaning in high-volume and 3D data, there is tremendous benefit in interactive ways to present and investigate all the data in full detail.
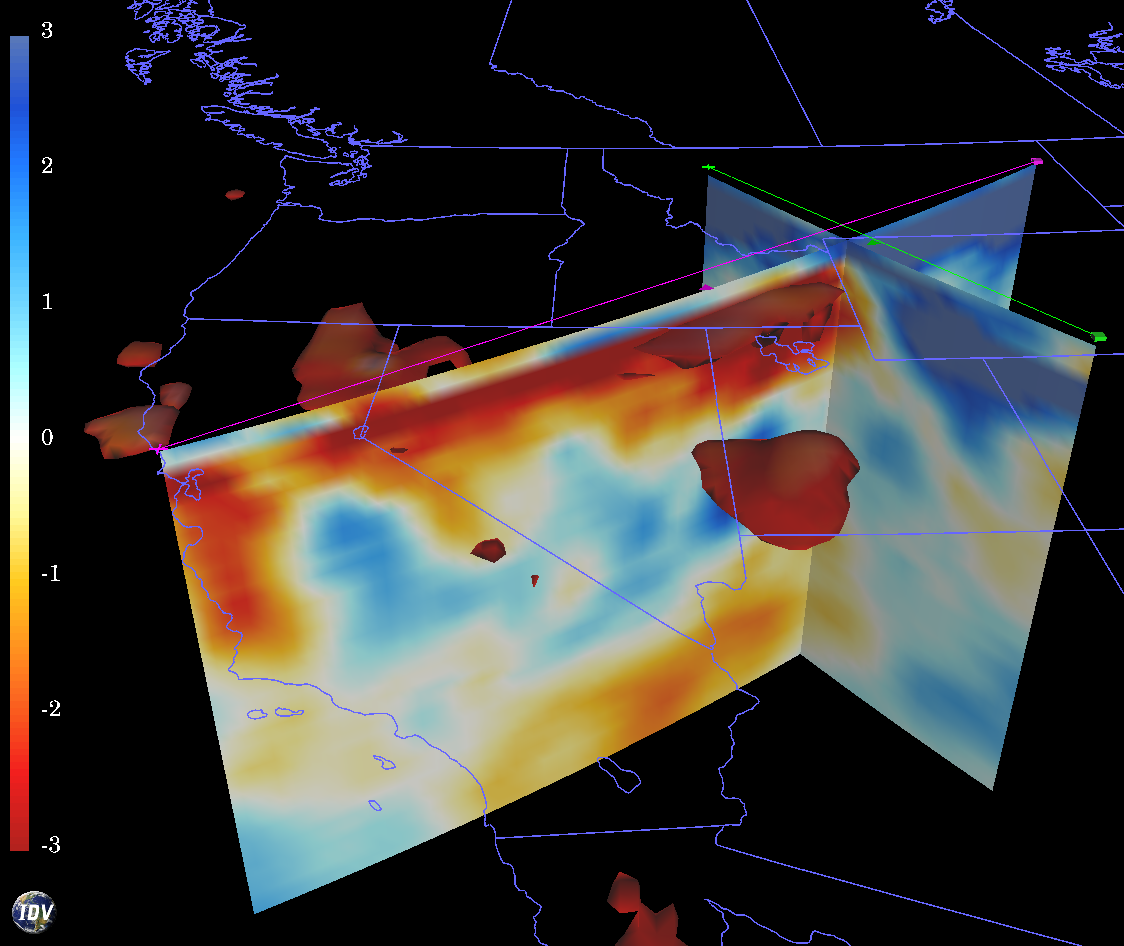
The image is a static capture of the DNA10S tomography model in an IDV 3D display, with two vertical cross-sections and a -4 percent delta Vs -isosurface. Click for full size.
The IDV provides:
The IDV uses the full strength of the human eye, mind, and perception to discover and understand meaningful details and time variations in complex spatial data. IDV displays, including imagery, time animations, and movies of 3D displays, are also very effective in presentations.
To see details about how the UNAVCO IDV handles geophysics data, see
earthquake epicenters and focal mechanisms,
mantle convection models with time animation, and other numerical dynamic models,
and other geoscience data and displays.
The IDV is an advanced data display and manipulation tool. Like all such tools, it requires some training and time to use well. Begin with the UNAVCO IDV User Guide, the Unidata IDV user guide, or attend an IDV workshop at Unidata in Boulder.
The IDV is not intended to make publication-quality images, though you can use the images it makes any way you like. The IDV is primarily designed for interactive 3D exploration and visualization of Earth science data. For presentations, you can make impressive data displays with the IDV to show key features, and then add decoration to IDV imagery with graphics software.
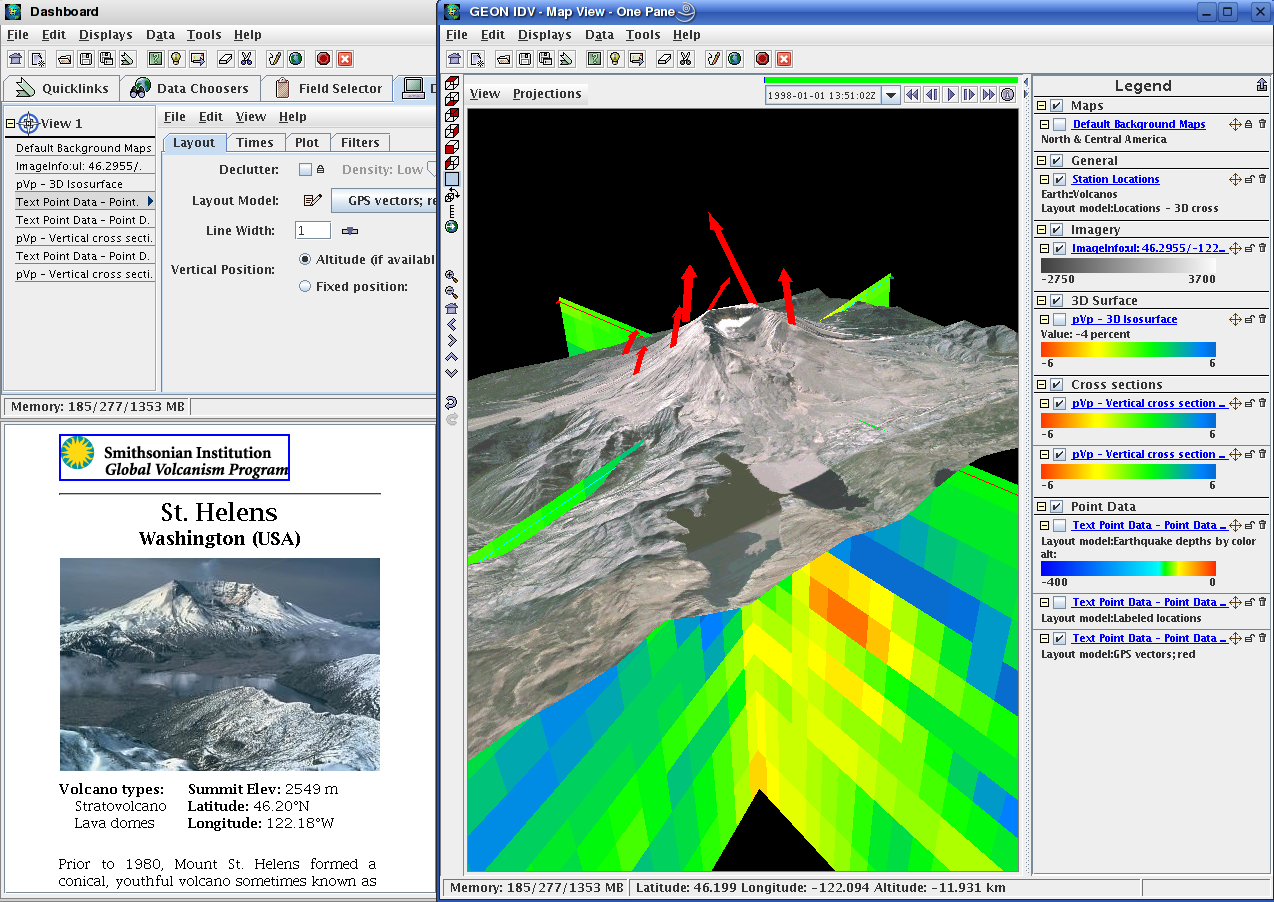
Click above to see a desktop with IDV windows showing Mt St Helens in 3D topographic relief using a USGS high resoultion DEM, an arial photo of the ground, seismic tomography, 3D GPS velocity vectors, IDV control panels, and the Smithsonian Institution information page for this volcano displayed with the IDV.
Click to see a 3D oblique view of Yellowstone region geophysics from the southeast with a seismic tomography grid (data courtesy of R. Smith et al., Univ Utah) displayed both as isosurfaces and a vertical cross section, GPS velocity vectors (purple; UNAVCO PBO), earthquake focal mechanism beachballs (R. Smith et al., Univ Utah), surface fault lines (green; USGS shape files), and semi-transparent 3D surface relief (USGS). The Yellowstone caldera is outlined in red (USGS). The straight red line can be dragged to change the position and angle of the cross-section. Mouse drags on other parts of the display pan, zoom and rotate the display (not active in this static image capture).
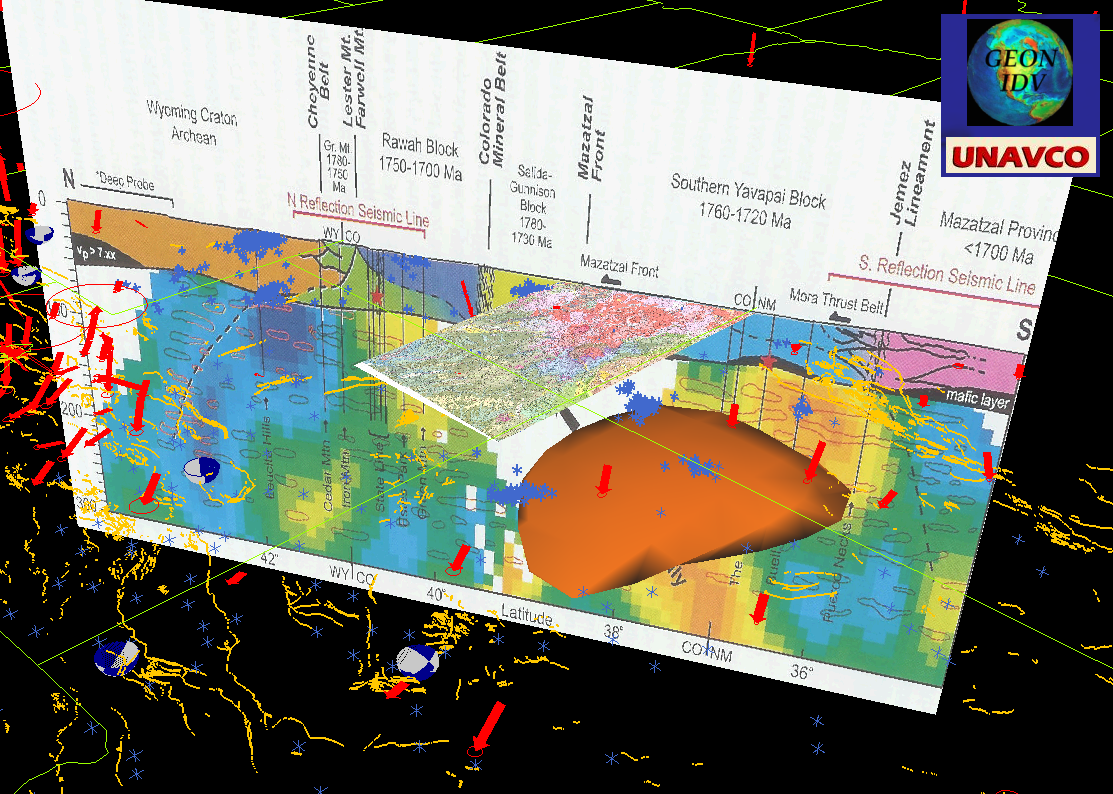
Click to see UNAVCO IDV image of Colorado region geophysics, oblique 3D view from southwest. Geophysics summary cross section (Karlstrom al. 2006, Plate 3), geology map (Colorado State GS), seismic tomography isosurface (S. Van der Lee et al.; orange), seismicity (IRIS DMC archive; blue crosses), earthquake focal mechanism beachballs (Global CMT Project), surface faults (USGS; yellow), and GPS surface velocity vectors (UNAVCO Plate Boundary Observatory, red). The live display in the IDV is fully interactive in 3D with zooming, panning and rotation in any direction, and toggling data types.
The IDV enables the goals of cyberinfrastructure, with online data access using several protocols, simultaneous use of diverse remote and local data sources, diverse data types, computations for data analysis, sophisticated visualization, and aids for collaboration such as sharing IDV bundle files. All these tools promote cyberinfrastructure's "vertical and horizontal" vision for data analysis. The IDV displays are full interactive, and can display multiple data sources and types in one view.
The UNAVCO IDV is based on UCAR's Unidata IDV for meteorology. Together they provide visualization for physical sciences of the Earth. The Unidata IDV is a "meteorologically oriented, platform-independent, application for visualization and analysis," begun in 2000 as an early cyber infrastructure tool for support of research in meteorology. Hundreds of meteorological researchers now use the Unidata IDV. Unidata is part of UCAR a top national meteorological research center funded by the NSF, in Boulder Colorado. The UNAVCO IDV was created by UNAVCO with funding from the GEON program, in 2004 - 2007.