The IDV can plot epicenters, with symbols optionally colored or sized for magnitude, or colored by depth. (See also Focal Mechanisms in the IDV.)
This page was revised in February 2016 to remove references to data sources which are no longer available or which no longer work with the IDV.
Quick Start:
1. Get Data
Use the online data search and download tool, USGS Earthquake Search.
Make a "Format CSV" file with the details about which earthquakes you want. Save the .csv file.
2. Edit the data file for IDV use:
a. open the csv file in a text editor and comment out the first (header) line by putting a # character in its first position.
b. Insert these two lines exactly for new 2nd and 3rd lines, just before the data lines, and just after the # USGS header line:
(index) -> (Time,Latitude,Longitude,Altitude,magnitude)
Time[fmt="yyyy-MM-dd'T'HH:mm:ss.sss'Z'"],Latitude[unit="deg"],Longitude[unit="deg"],Altitude[unit="km" scale="-1.0"],magnitude[unit="null"]
3. Open the data file in the IDV with Dashboard Data Choosers tab, using "Data Source Type" of "Text Point Data files."
4. In Dashboard Fields, chose "point data" and "Create display." See below ("Plot Your Earthquake Data in the IDV") for how to show all the earthquakes in one view.
To learn more about "VisAD" ascii text files (.csv with header) used for "point data" in the IDV, such as for earthquakes, see:
Unidata IDV Workshop for version 5.2 > Accessing and Displaying Data > Point Observations > 3.7.8 Text (ASCII) Point Data from Unidata,
and The VisAD TextAdapter from the University of Wisconsin.
Further contents of this page:
Plot Your Earthquake Data in the IDV
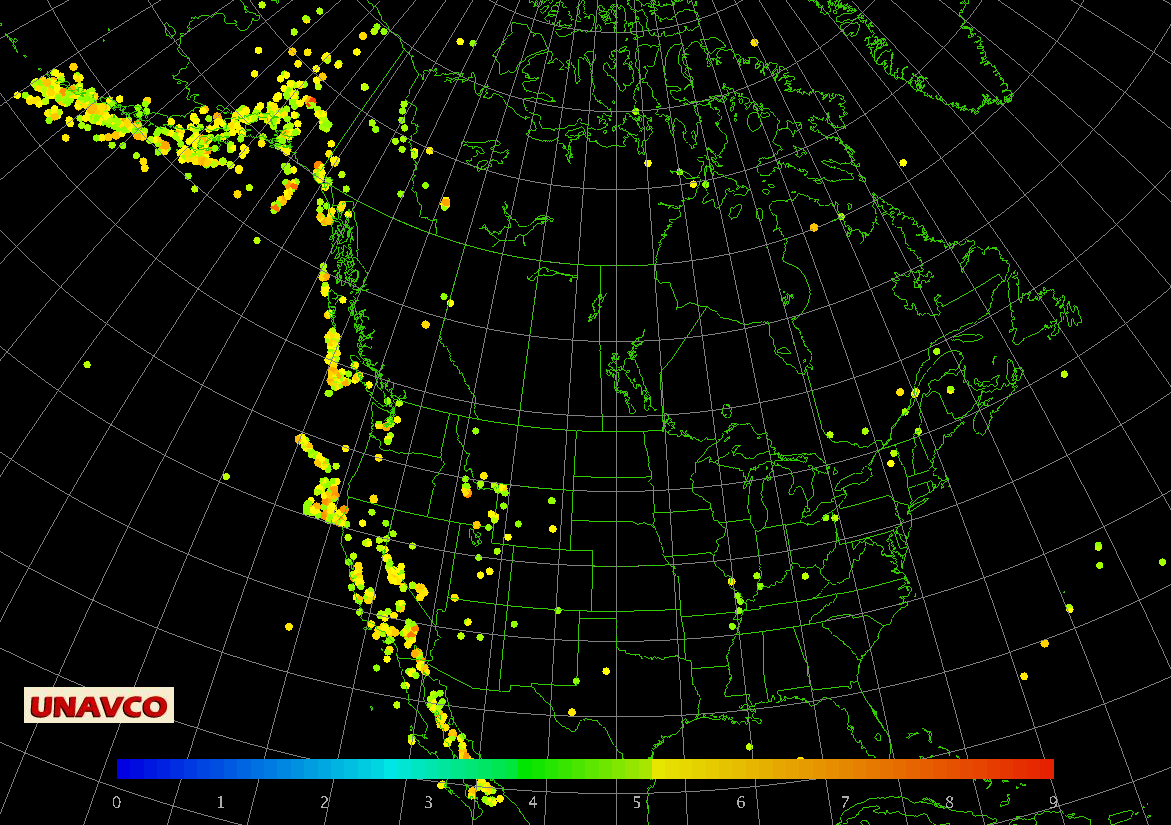
Coloring Plot Symbols by Magnitude or other parameter values
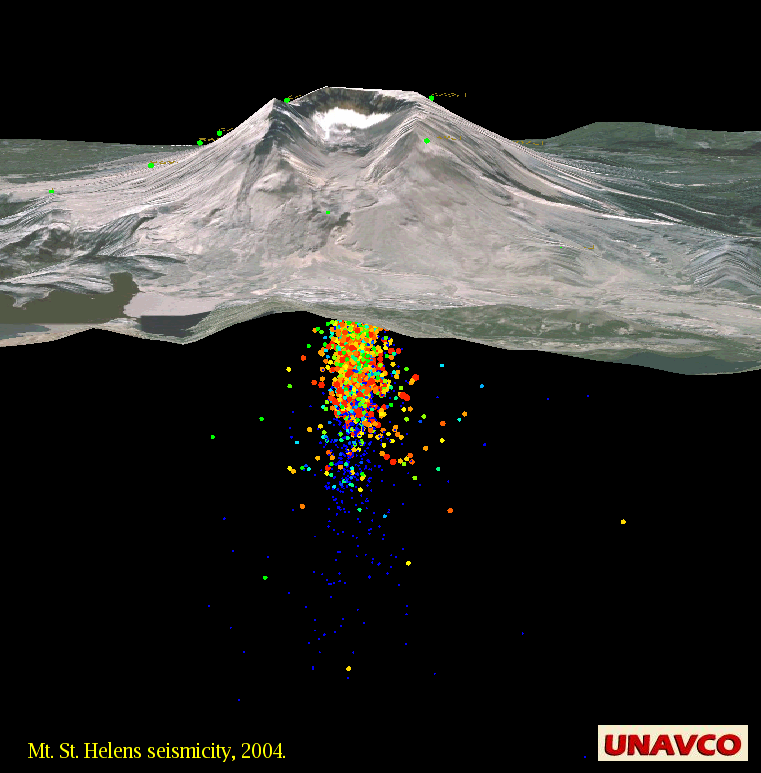
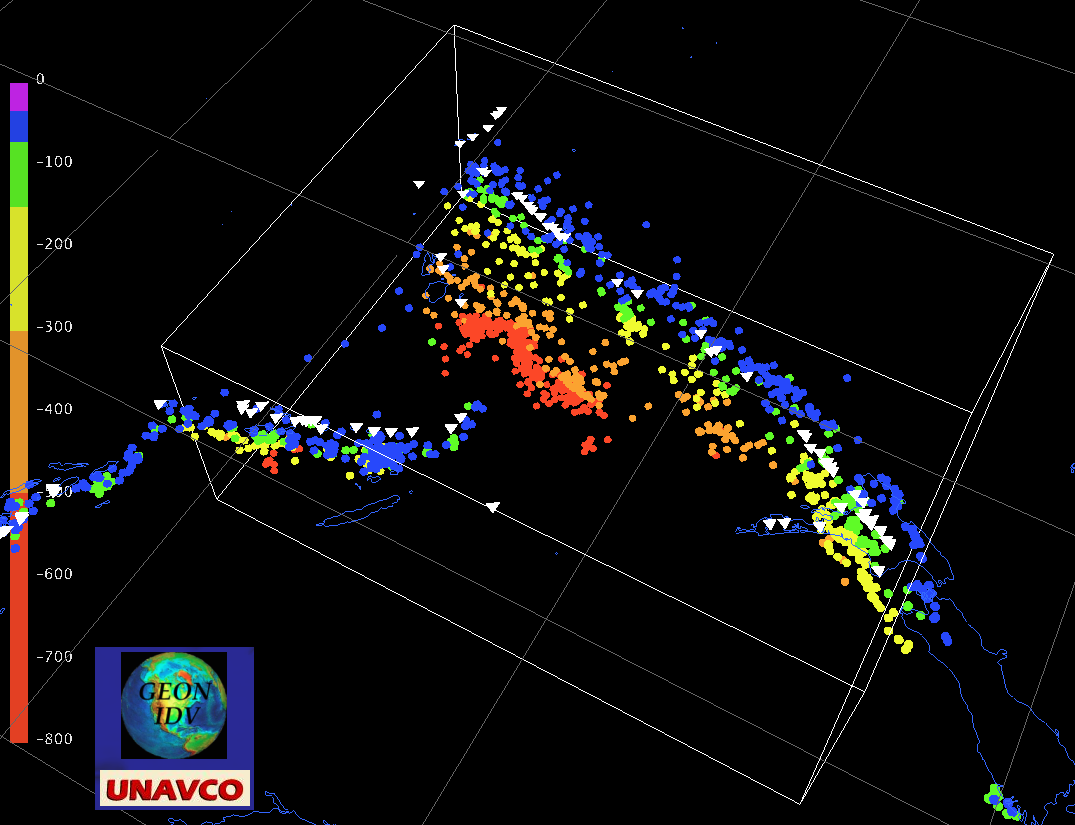
Coloring Plot Symbols by Depth and Sized by Magnitude
The IS0 8601 time format
Sample IDV earthquake location displays:
Images captured from IDV hypocenter displays. Click to see full size image. Original displays in the IDV are interactive and have full 3D rotation and zoom.
Plot Your Hypocentral Data in the IDV
In the IDV Dashboard, find the local .csv data file's location in the Data Chooser's Files browser. For ".csv" files (ascii point data format) be sure to use Data Source Type of "Text Point Data files" in the Dashboard's Data Chooser.Click on Add Source. The Field Selector panel appears. Then choose "Point Data" in Fields and click "Create display."
Since the earthquakes have different times the first plot to appear on the IDV will show only one symbol for the earliest time. In the display control window for the plot, click Times tab, click on Multiple.
The initial plot is 'decluttered.' To reduce decluttering and see all quakes in one map, in the display control window for the plot, click Layout tab, and check off "Declutter." Or you can check declutter and adjust the "Density" slider.
To change the plot symbol, change the "Layout model" choice. There are two or three types for earthquakes. Also see the sections below "Coloring Plot Symbols by Magnitude or other parameter values" and "Coloring Plot Symbols by Depth or Altitude and Sized by Parameter Magnitude" for more about "Layout Model" (plot configuration) in the IDV.
See sections in the UNAVCO IDV User Guide about zoom, rotation, display legends and controls, map controls and projections, vertical scale, and how to capture displays as images and movies.
Coloring Plot Symbols by Magnitude or other parameter values
To create plot symbols colored by parameter value, choosing the parameter value range and color table:
In the main menu, choose Tools-Layout Model Editor

choose File-New

Enter "Layout Model Name"  such as "eqs mags 1 to 3.5"

Click on Shape in left side of the Layout Model Editor

Click in center of drawing area (white square)

in Properties Dialog - Shape Symbol window appears

choose Shape: Sphere
   (filled circle, square, triangle, etc., are flat 2D symbols unsuitable for 3D displays)

click on "Color By" tab

enter name of the variable in your data file to color by value in "Map Value of:"
   such as m, val, magnitude, mb, or Ms

enter "Data Range:" in the two boxes, such as 1.0 3.5.
   These are the limits of the color table; the scale is linear.

set "Color Table" choice such as VisAD.

You may use the Scale Size tab to scale the plot symbol size by magnitude.

click OK to finish the Properties Dialog - Shape Symbol window.

In white drawing area, move the symbol to the exact center, if not already there,
   with a mouse button one drag, or (better) with a right button click on the symbol
   followed by menu choice center->center.

do File-Save; this creates and saves a new 'layout model' (plot configuration)
   called "eqs mags 1 to 3.5"

do File-Close to close the Layout model editor

After you connect to your epicenter data, the first plot probably uses the Location
   symbol, a cross. In the Display Control window for this
   set of data, set "Layout Model:" to the name of your new layout model or symbol,
   such as "eqs mags 1 to 3.5"

To change properties of an existing layout model, open the layout model editor,
   choose the Layout Model from the list; do a right mouse click on the plot symbol
   in the drawing area to see a menu, and choose Properties.
Coloring Plot Symbols by Depth (Altitude) and Sized by Magnitude
To create plot symbols colored by depth and sized by magnitude:
In the main menu, choose Tools-Layout Model Editor

File-New

Enter "Layout Model Name"  such as "crustal earthquakes"

Click on Shape in left side of the Layout Model Editor

Click in center of drawing area (white square)


The Properties Dialog - Shape Symbol window appears

Choose Shape: Sphere
   (filled circle, square, triangle, etc., are flat 2D symbols unsuitable for 3D displays)

In Color By tab, Map Value Into Color Table tab:
Click at right end of "Map Value of:" entry box
to see
Current Fields->Point Data; click on Altitude.
Set "Data Range:" such as -30.0  0.0 in the  two boxes, and "kilometers" in the "Unit:" box.
  (Depths below the surface are usually negative in IDV data).
   Set "Color Table" choice such as VisAD.

In the "Scale Size" tab:
Enter your variable name, such as magnitude, for Scale By Parameter, and for Data Range
   enter for example 1.0 4.5.  For "Scale By Factor:" enter, for example, 1.0 and 4.0.
   You will need to experiment to get the sizes right.

Click OK to finish the Properties Dialog - Shape Symbol window.


In the white drawing area, move the symbol to the exact center, if not already there,
   with a mouse button one drag, or (better) with a right button click on the symbol,
   followed by menu choice center->center.

do File-Save; this creates and saves a new 'layout model' (plot configuration)
   called "crustal earthquakes."

do File-Close to close the Layout model editor.


After you connect to your epicenter data, the first plot probably shows the Location symbol,
   a cross. In the Display Control window for this set of data, set "Layout Model:"
   to the name of your new layout model or symbol, such as "crust earthquakes."

To change properties of an existing layout model, open the layout model editor,
   choose the Layout Model from the list; do a right mouse click on the plot symbol
   in the drawing area to see a menu, and choose Properties.
The IS0 8601 time format
To learn about the IS0 8601 time format, see:
A summary of the international standard date and time notation by Markus Kuhn,
Date and Time Formats, and
ISO 8601 Date and Time Formats.