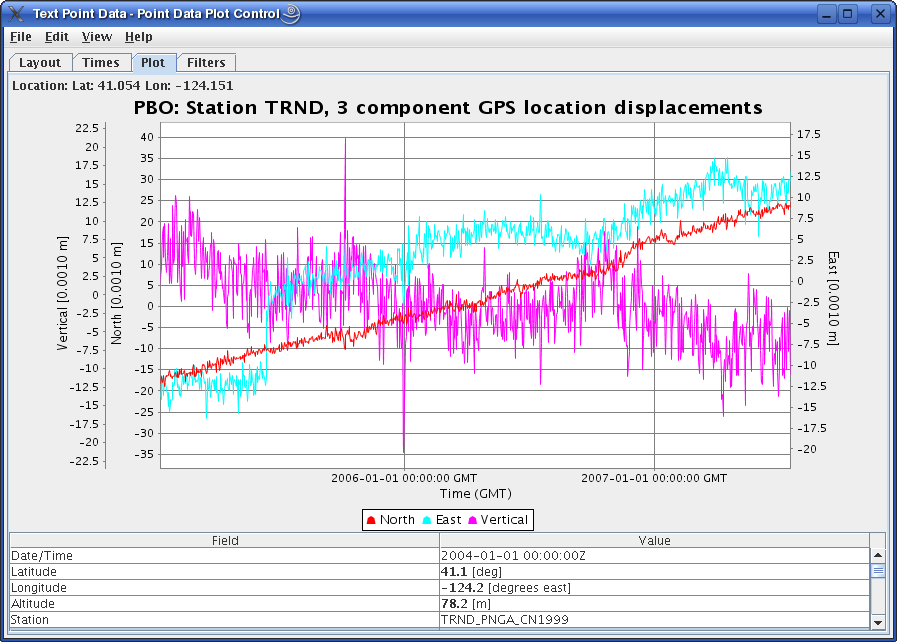
The UNAVCO IDV can display GPS velocity vectors and error ellipses, and overlay the velocity plots on other geophysical data such as surface maps and 3D topographic relief. The IDV can also display time series of GPS station position displacements (north, east and vertical components, and their error estimates with time).
GPS velocity vector data may have 2 components (east and north), or 3 components including vertical, and in that case the IDV will plot GPS vectors in 3D. An overhead map view will show only the horizontal vector in either case.
-
Put Your GPS Velocity Data in the UNAVCO IDV
GPS Vel 1.0 ITRF 2000" Velocities
(To show velocities vectors, your copy of the IDV must use a "UNAVCO IDV plugin" made March 24, 2009 or later.
Put Your GPS Velocity Data in the IDV
click for full size
Look at this sample GPS velocity vector data file for the IDV. Each line is one station's values. The values are separated with commas. This data format allows plots of velocity vectors (from ve,vn) and error ellipses (from sigx,sigy,corrxy), The IDV requires time and altitude for each observation and in this example those values are are set to one time and one altitude (0); note the time format. There is a 4-character station label at the end of each data row.
Alternately, time and altitude can be shown in each data row in the correct order position. There is no vertical velocity value in the first example; add a new item "vz[unit="mm yr-1"]" if you need vertical. This sample data file includes time, altitude, and vertical motion components at each station, but no station id. vz downwards is negative. Time is defined to seconds.
The tail is the station location since for crustal motion the interest is where a point is headed, not where it went. The UNAVCO IDV layout models put the station id at the station location, if a station id is supplied. See this example display.
Put your data in a file with one of these formats. Keep the filename extension 'csv.' For more about this file format for the IDV, see the Unidata IDV User's Guide: Text (ASCII) Point Data Format.. For best use of the IDV, all variables need unit names. For recognized names of units use the UD units and see Supported Units.
Time is required by this format, but you can of course use any time you like, including a dummy or placeholder value. Tine is used by the IDV to merge separate data sources at one time in one plot, or for time animation.
Making a Display
Load your data file in the IDV with the Dashboard window, Data Choosers -> Files, and find your file. Click on "Add Source."
In the dashboard "Fields" panel in the center, click on "Point Data." For "Layout model," choose one of the "GPS vectors" choices provided by the IDV (the IDV has no vectors). Click on "Create Display." Note that in the overhead view (CTRL-R) you cannot see the vertical component of velocity.
You can control vector length scaling, using the "Scale" entry box in the Display control window that pops up when the display is made. The Declutter check box reduces the number of symbols in the display. Read more about Point data plots and Working with the Point data Plot Symbols using "Layouts Models". To zoom, pan, and rotate see Zoom, pan and rotate. See also Making GPS Displays - More Details.
Here is an IDV bundle file that should make a GPS display in your IDV after you add the new IDV plugin. It uses the sample data file shown above. Load it with the URLs window in the Data Choosers.
- IGS05 Reference Frame
- IGS08 Reference Frame
- North America 2008 (NAM08) Reference Frame
- SNARF version 1 Reference Frame
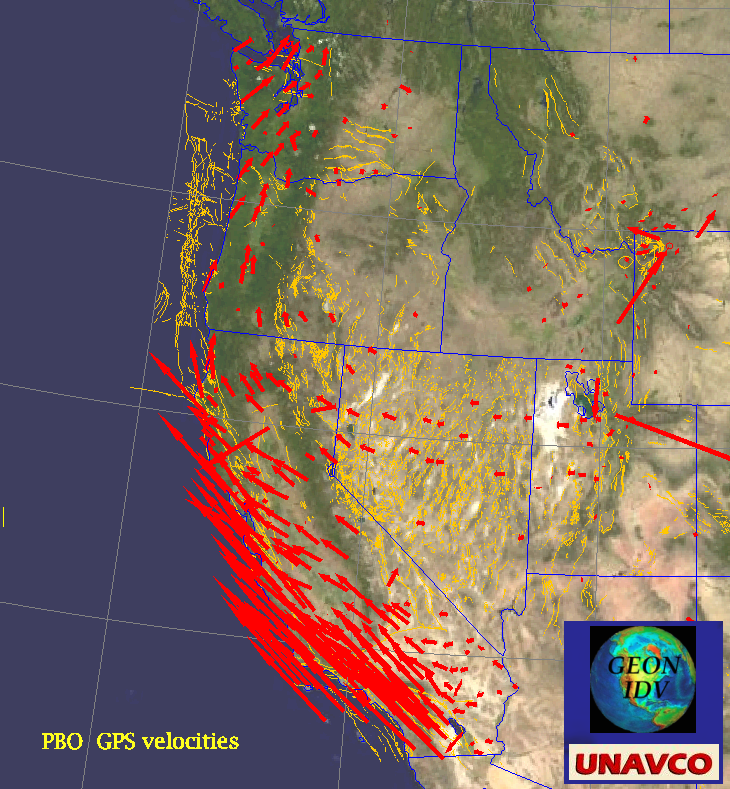
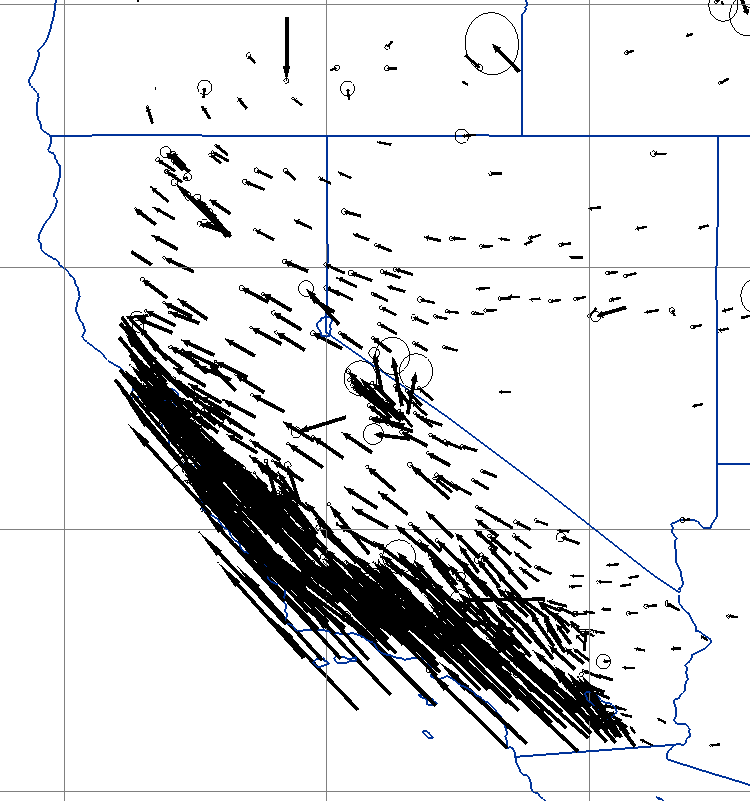
UNAVCO IDV display of PBO GPS velocities, USGS surface fault lines, and JPL "Blue Marble" satellite image.
Click to see full size.
Original Data Source:
The sources for the GPS velocity data for the PBO and co-processed stations, the
combined products from the GPS Analysis Center at MIT, are online at:
A PBO "pbo.final_frame.csv" data file with a modified header for UNAVCO IDV use is here: pbo_final_frame.csv.
To load this data source into the IDV, just copy the link location (URL); you do not need to download the file. Enter the URL in the URLs entry box in the IDV Dashboard's "Data Choosers" window. Click on Add Source. In the dashboard "Fields" panel in the center, click on "Point Data." For "Layout model," choose "GPS vectors"(black or red). Click on "Create Display." to make a "Text Point Data" display. Change the "Location Model" (in the display control) "GPS velocity vectors" (red or black). In the display control for the "Text Point Data" display, click on the "Times" tab, click on "Show: Multiple" to see all data times in one display. To declutter (see all vectors), in the "Layout" tab, click off the "Declutter" check box.
click to see full size
You can plot time series from GPS stations in the IDV, for the PBO nretwork and a few others around the globe. You click on the station symbol on the map, for the station of interest.
Original Data Source:
The sources for the GPS velocity data for the PBO and co-processed stations, the
combined products from the GPS Analysis Center at MIT, are online at:
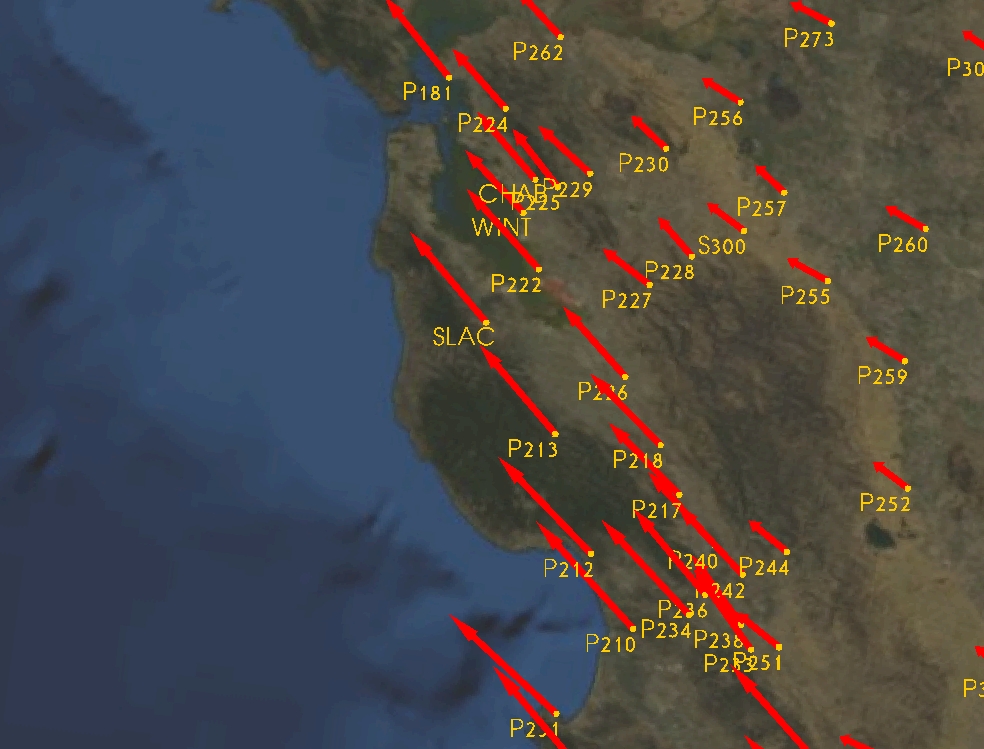 SLAC regional stations and GPS velocities
  SLAC time series
 GPSVEL 1.0: U.S. plot
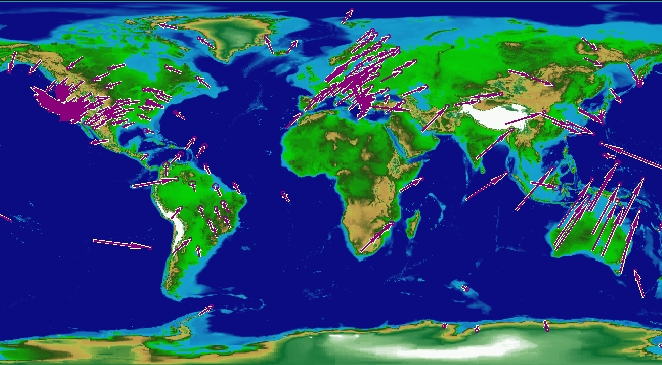 GPSVEL 1.0: global plot