Global Navigation Satellite System reflectometry obtains information about Earth’s surface from satellite signals that were reflected off Earth’s surface before reaching an antenna. When energy like microwave radiation interacts with substances like soil and vegetation, some of it is absorbed, some passes through, and some is reflected. The amount that is reflected depends upon the dielectric constant and the angle of the incoming radiation. The dielectric constants of soil and vegetation are largely dependent on water content, as materials with lower water content will have lower dielectric constants. Because GNSS satellite signals are transmitted at microwave wavelengths, they can be used to analyze the terrestrial hydrologic cycle through reflectometry.
GNSS reflectometry began as a satellite technique to record ocean roughness or sea surface altimetry with instruments like the UK DMC, which was launched in 2005 and recorded usable GNSS reflections only over water. In 2014, Surrey Satellite Technologies launched the Tech Demo Sat-1 (TDS-1) satellite. While predominantly used for ocean observations, large variations in the reflected GNSS signal over land could be used to identify rivers. Data from TDS-1 was still highly limited, though, as this single satellite only passed over a given location every eight days. It wasn’t until the Cyclone Global Navigation Satellite System (CyGNSS) was launched in 2016 that we obtained continuous land observations. From this data, scientists were able to determine that the reflected GNSS signal was impacted by soil moisture.
Soil moisture is the amount of water that is contained within sediment. Within soil, pore space exists between grains and can be filled with either air or water. Soil moisture data is critical for monitoring drought. This is often measured through gravimetric sampling: weighing a soil sample, drying it thoroughly, and then weighing it again. That is a time-intensive process and requires many samples to accurately determine the soil moisture of an area.
Two dedicated satellites that currently track soil moisture are the European Space Agency’s Soil Moisture and Ocean Salinity (SMOS) satellite and NASA’s Soil Moisture Active Passive (SMAP) satellite. Both satellites passively measure microwave radiation emitted by water in the soil, rather than using a reflected signal. The data obtained by these instruments are able to tell us about soil moisture at the surface around the world.
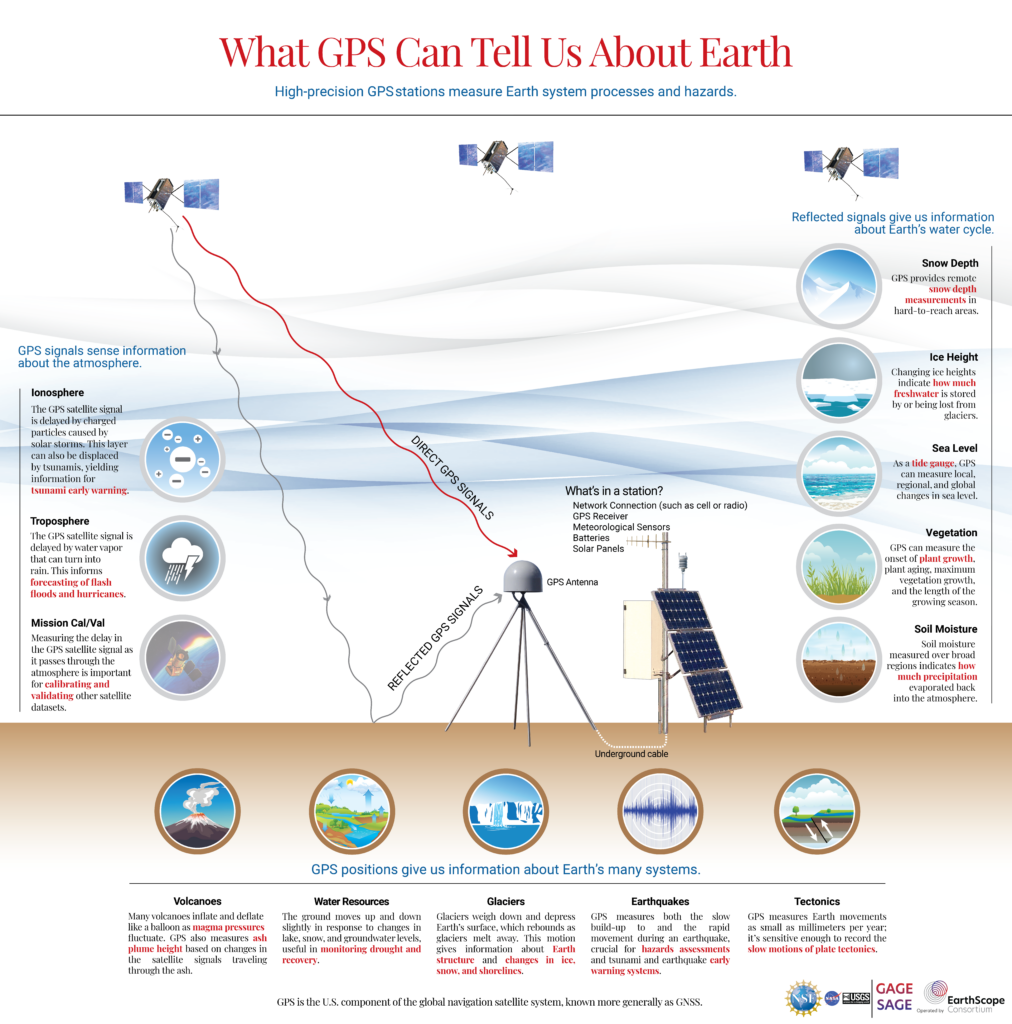
Reflectometry can also be used to measure other aspects of the terrestrial hydrologic cycle. One specific technique called GNSS interferometric reflectometry (or GNSS-IR) applies this concept to the interference between reflected waves and the direct satellite signal reaching a GNSS ground station antenna. This can be used to measure the amount of snow on the ground, the amount of water within vegetation, the level of a body of water, or the amount of soil moisture. This is valuable for understanding drought evolution and natural hazard (like flooding and wildfires) predictions.
GNSS-IR requires a GNSS antenna and a receiver that is within a few meters of the ground. A GNSS antenna captures the signals transmitted by GNSS satellites. The receiver records the signal-to-noise ratio, or the strength of the received signal compared to the amount of data noise. The direct signal, which the antenna aims to receive, travels directly from the satellite to the antenna and is used to calculate its position. The waves that are reflected off nearby surfaces before they hit the antenna, making what are called “multi-path” signals, are usually disregarded as noise and are generally minimized when designing GNSS stations and antennas.
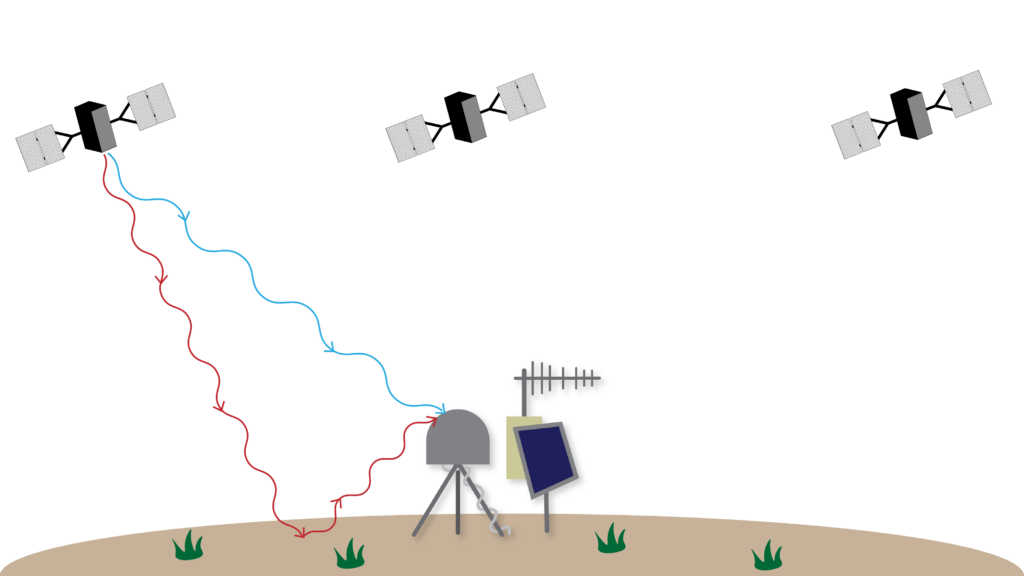
The reflected and direct signals will interfere with each other—particularly when the satellite is low in the sky. When the satellite is overhead, the GNSS antenna receives a stronger direct signal. Interference is easily visible in the signal-to-noise ratio, which oscillates as the length of the reflected signal path changes in relation to the signal wavelength.
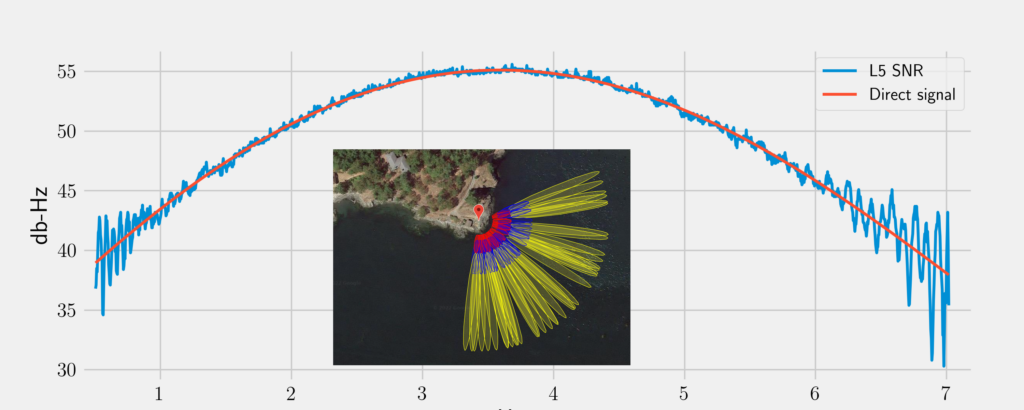
So how do scientists actually use GNSS-IR for things like figuring out soil moisture or snow depth? Plotting the signal-to-noise ratio data as the satellite moves in an arc above the antenna reveals the oscillations that can tell us about its surroundings.
Geodesists fit a sine curve to the data in order to look for changes in amplitude, period, or phase as a result of physical changes in the surroundings. The factors that are changing reveal information about the surface that the signal reflected off of. The frequency of the sine wave is a function of the height of the GNSS antenna from the surrounding surface—whether that’s the ground, the snow or vegetation covering it, or a body of water. This technique can turn a GNSS station into a tide gauge. Similarly, if there is a change in the phase shift of the signal-to-noise ratio data with time—the extent to which the phase of the direct signal wave aligns with the phase of the reflected signal—there has likely been a change in soil moisture causing a change in the dielectric constant.
Over the years, a great deal of effort has gone into quantifying sources of noise so that corrections can be applied to improve the precision of GNSS position measurements, but this also led to new applications like reflectometry—because some of that “noise” is really just another signal!