Data format is an IDV csv file. Display symbol is Layout->strain cross.
PBO Strainmeter Data and Plots
Work is just beginning on getting PBO borehole strainmeter data in the IDV, so you can integrate strainmeter data in IDV displays with other geophysics data.
Also, be sure to use the PBO tool
SQUID
which is a great way to work with strainmeter data.
To get PBO strainmeter data, and convert the file format to work in the IDV, do as follows:
go to
http://pboweb.unavco.org/ PBO
http://pboweb.unavco.org/?pageid=89 PBO Strainmeter Products
scroll down to the station you want, such as B073
click on the ASCII link in the column "Processed data ASCII"
A new window opens; in it "save link target," as for a link such as B073.2008.bsm.level2.tar.
Untar that file on your system (tar -xf B073.2008.bsm.level2.tar).
Gunzip the files with strain components of interest (gunzip B073.2008.xml.2Ene.txt.gz),
such as B073.2008.xml.2Ene.txt.gz, B073.2008.xml.Eee-Enn.txt.gz, and B073.2008.xml.Eee+Enn.txt.gz
These are ASCII files with space-separated rows of data values by time.
To make ASCII files that work in the IDV, csv files with the right header lines, do as follows.
copy the file B073.2008.xml.2Ene.txt to a new file with a name like B073.2008.xml.2Ene.csv
Remove the first line of header information.
Replace all tabs with commas (for example, use vi command 1,$s/\t/,/g ).
Replace the T in the date and time field with a space (for example, use vi command .,$s/T/ /g )
Add new header lines at the top like this (for the 2Ene file):
(index) -> (Longitude,Latitude,Altitude,Station(Text),Time,MJD,shear_2Ene,s_offset,strain_quality(Text),tide_c,detrend_c,atmp_c,atmp_c_
quality(Text),level(Text),version)
Longitude[unit="degrees east"],Latitude[unit="deg"],Altitude[unit="meter"],Station(Text),skip,Time[fmt="yyyy-MM-dd HH:mm:ss"],skip,MJD[
unit="null"],shear_2Ene[unit="null"],s_offset[unit="null"],strain_quality(Text),tide_c[unit="null"],detrend_c[unit="null"],atmp_c[unit=
"null"],atmp_c_quality(Text),level(Text),version[unit="null"]
Longitude=-120.4717
Latitude=35.9467
Altitude=535.28
Station=B073
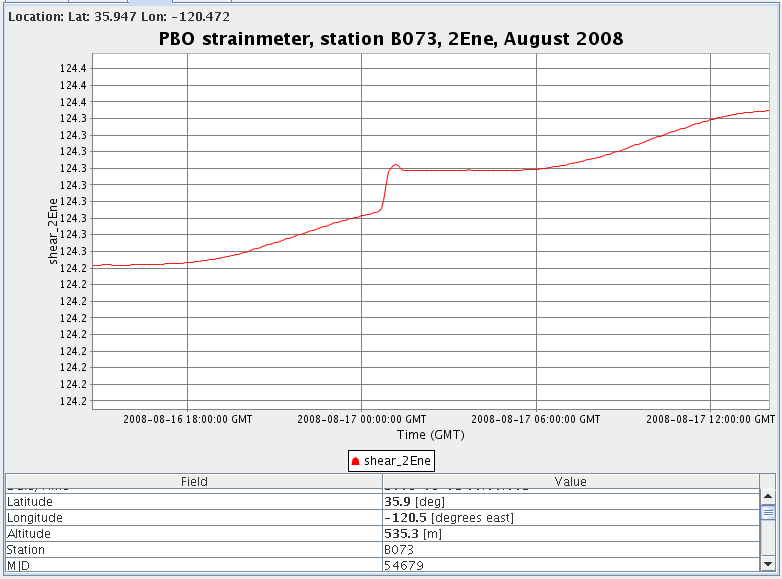
"2Ene",2008-01-01T00:00:00,1,54466.000000, 105.0486, 0.3204,g, 0.0001, 105.4735, -0.0049,g,2b,2008278001715
"2Ene",2008-01-01T00:05:00,1,54466.003472, 105.0488, 0.3204,g, -0.0000, 105.4738, -0.0050,i,2b,2008278001715
Enter the correct latitude, longitude, altitude and station name. Find the information by clicking on the station name
in http://pboweb.unavco.org/?pageid=89
(such as http://pboweb.unavco.org/shared/scripts/stations/?checkkey=B073)
Since the IDV cannot easily handle large files like this, with say 100,000 lines, remove the lines except for the
time interval you are interested in. In this case the data from August 2008 was saved.
copy the file to a new file with a name like B073.2008.xml.2Ene.Aug2008.csv
A sample of this kind of file is online here: display_images/B073.2008.xml.2Ene.Aug2008.csv
Load this URL into the IDV Data Chooser. Choose Data Source Type of "Text Point Data Files." Click "Add Source."
Create a "Point Data Plot" display. In its display control, do View->Undock from Dashboard.
Click on the Plot tab. Now you can resize the plot by resixzing the window. In the map display, click on the symbol
at the station where you want to see the time series. In the display's control, Plot panel, you should see the station name
and location appear in a list below the chart; DOUBLE click on a variable name
(in that same list as the station name) to plot the time series of that variable.
Do a right click on each variable name in the list to remove, or add, that variable to the time series plot.
Do View->Chart->Chart:(chart title)->Zoom In->Domain Axis to zoom in along the time axis (shorter time range).
To add a title to the plot, right click on the time series plot, choose menu choice Properties.
In the Name entry box add your title. To save an image of the chart, do View->Chart->Chart:(chart title)->Save chart as.
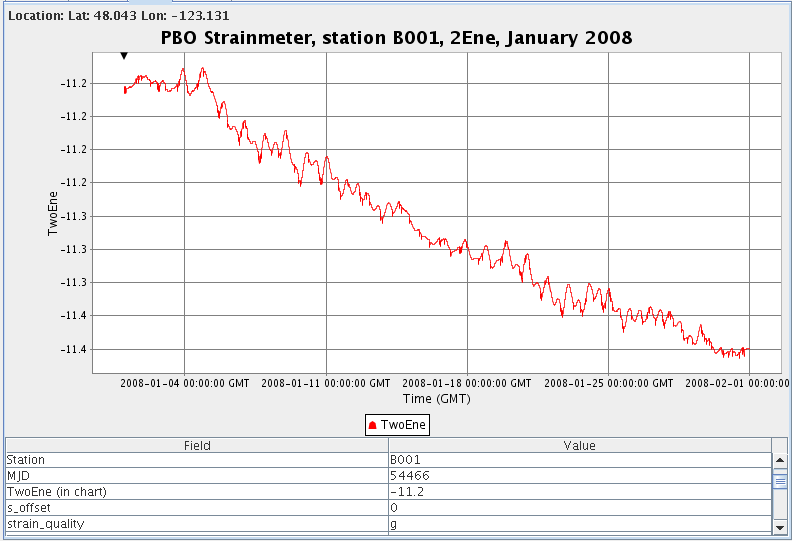
IDV Plots of PBO stainmeter data with no corrections for tides of long term trends: