
280 Ma
Click to download: 280 Ma Quicktime movie (13 MB) 280 Ma animated gif movie (9 MB)
Click to download: 600 Ma Quicktime movie (16 MB) 600 Ma animated gif movie (11 MB)
Professor Ron Blakey, Department of Geology, Northern Arizona University, has created remarkable images of the surface of the Earth throughout geological time, and provides them online (see Global Paleogeography).
Professor Blakey says "The paleogeographic maps on this site are representative of my many years of constructing these maps. They are made by plotting data and interpretations from the geologic literature and then painting the maps to look like satellite views of Earth's past. Thousands of publications were used in constructing these maps.... The ages in millions (Ma).... All maps are copyright to me, Ron Blakey, and may by used, with citation to Ron Blakey, NAU Geology, for educational, non-profit, non-commercial purposes."
The IDV can show these images in many map projections, animate them, and make video files. Examples are provided here. The particular images used are paleogeographic map images in rectangular format. Note that the IDV maps the rectangular images to the 3D globe.
Use this IDV XIMG file to load the image animation sequence in your IDV. Set your choice of map projection, map center, and zoom.
The Paleo Globe for 600 Million Years - History of Tectonic Plates Motion
280 Ma
Click to download:
280 Ma Quicktime movie (13 MB)
280 Ma animated gif movie (9 MB)
Click to download:
600 Ma Quicktime movie (16 MB)
600 Ma animated gif movie (11 MB)

65 Ma
Click to download:
280 Ma Quicktime movie (7 MB)
280 Ma animated gif movie (5 MB)
Click to download:
600 Ma Quicktime movie (8 MB)
600 Ma animated gif movie (6 MB)

65 Ma
Click to download:
280 Ma Quicktime movie (8 MB)
280 Ma animated gif movie (5 MB)
Click to download:
600 Ma Quicktime movie (12 MB)
600 Ma animated gif movie (8 MB)

35 Ma
Click to download:
280 Ma Quicktime movie (7 MB)
280 Ma animated gif movie (5 MB)
Click to download:
600 Ma Quicktime movie (11 MB)
600 Ma animated gif movie (8 MB)
Tectonic Tectonic Plate Outlines for 280 Million Years

80 Ma
Click to download:
Quicktime movie (13 MB)
animated gif movie (9 MB)
Today's Plate Motion Vectors (GSRM Plate Velocities)
The Global Strain Rate Map (GSRM) Project created plate velocity models for no net rotation and each major plate. For more about the GSRM project, see the UNAVCO IDV web page Global Strain Rate Map Data and Displays in the UNAVCO IDV.
Data Sources Online:
The GSRM project made plate motion velocity vectors on 1 by 1 degree grids,i from 80 S to 80 N latitudes. Netcdf grid files of the data is provided here.
global plate velocities for no net rotation: No Net Rotation
global plate velocities relative to the indicated plates:
AN Antarctica OK Okhotsk CR Caroline PH Phillipine SO Somalia
IN India SA South America CO Cocos SC South China AR Arabia
PA Pacific AT Anatolia AU Australia NZ Nazca EU Eurasia
NU Nubia CP Capricorn TA Tarim AM Amuria RI Rivera
ST Scotia JF Juan de Fuca NA North America SU Sunda CA Caribbean
To see a velocity data source in the IDV, first "copy link location" for that URL. Enter that link location in the URLs entry box in the IDV Dashboard's Data Choosers window. Be sure to first choose Data Source Type of "Im feeling lucky" for netCDF gridded data. Click on Add Source.
In the "Fields " panel in the Dashboard's Field Selector tab, click on the little button left of "2D grid." Click on the little button left of "Derived." Click on either Vectors the list which appears. Finally click on the large "Create Display" button. The diplay control can be used to change vector size, color, and density on the plot.

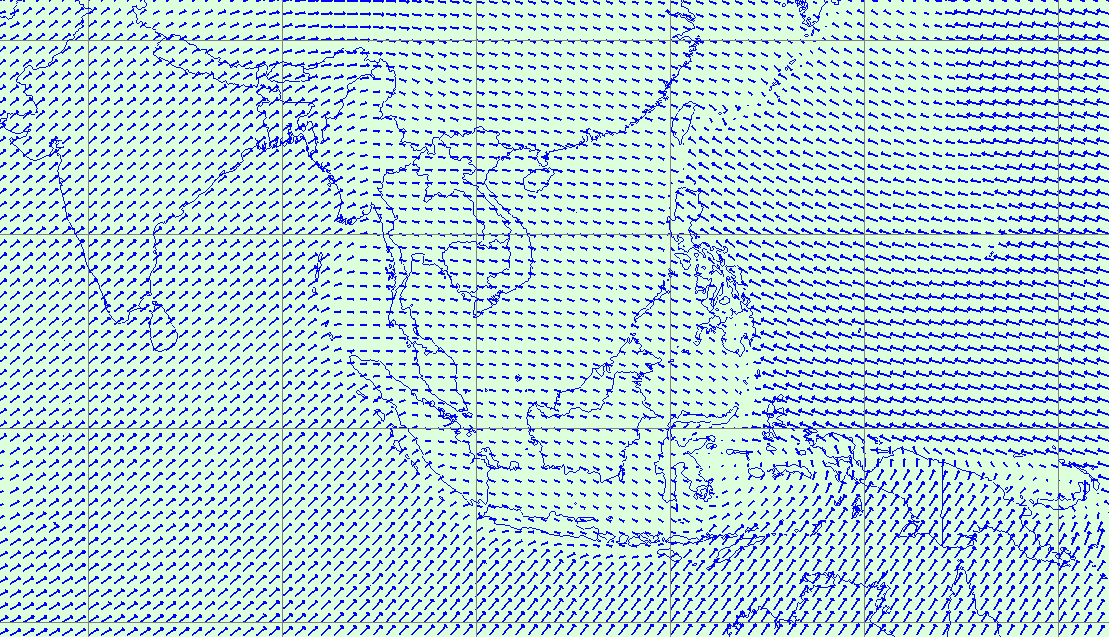
GSRM NNR Velocities, southeast Asia. Click for larger view
...
plain map
...
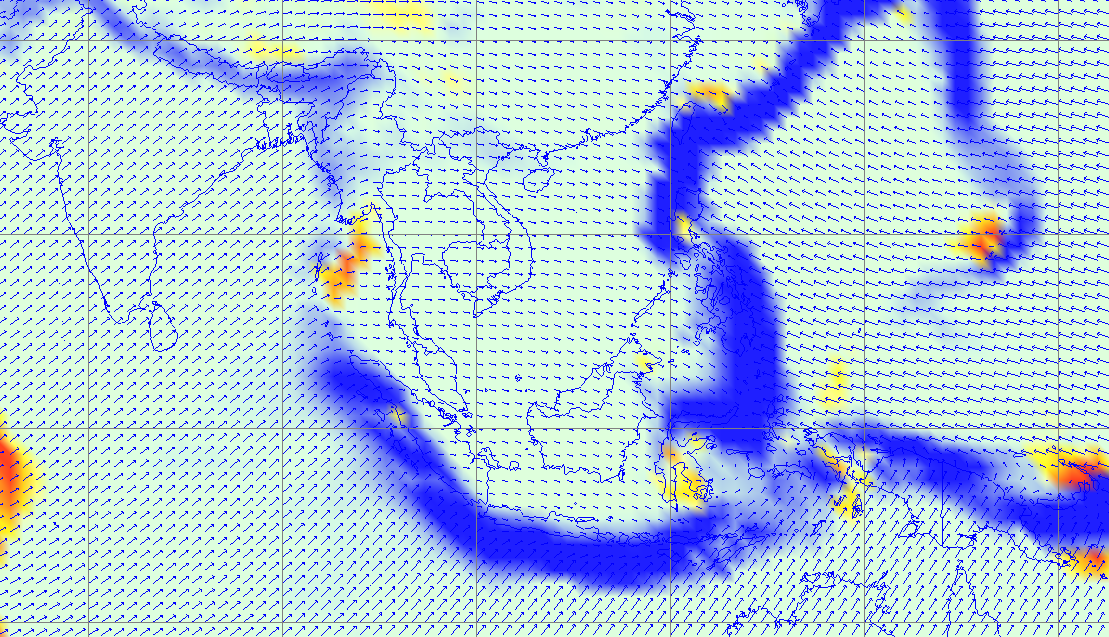
divergence plot
Publication:
The Global Strain Rate Map (GSRM) data is provided by Corne Kreemer.
See
Kreemer, C, A.J. Haines, W.E. Holt, G. Blewitt, and D. Lavalée,
"On the determination of a global strain rate model,"
Earth Planets Space, 52, 765-770, 2000; and Kreemer, C., W.E. Holt, and
A.J. Haines, "An integrated global model of present-day plate motions
and plate boundary deformation,"
Geophysical Journal International, 154, 8-34, 2003.
Publication Online:
See also http://gsrm.unavco.org/,
http://geodesy.unr.edu/cornekreemer/gsrm.htm, and
http://geodesy.unr.edu/publications/Kreemer_et_al_GSRM_2003.pdf
Plate Motion Vectors in Geological Time, and IDV-computed Plate Boundaries
Here is a data source of plate motion vectors from 170 Ma to 10 Ma.
Past Plate Motion Vectors Data Source for the UNAVCO IDV:
display_images/Lithgow-Bertelloni_Richards_Mesozoic_Cenozoic_Plate_Velocities.ncData Source Authors: C. Lithgow-Bertelloni and M.A. Richards
Publication online: http://www.agu.org/pubs/crossref/1998.../97RG02282.shtml
Data Source IDV data Type: 2D NetCDF grid of parameters vn and ve for 11 time steps
Format conversion for IDV use: Allen McNamara and UNAVCO, converted to netCDF <
Sample IDV Displays:
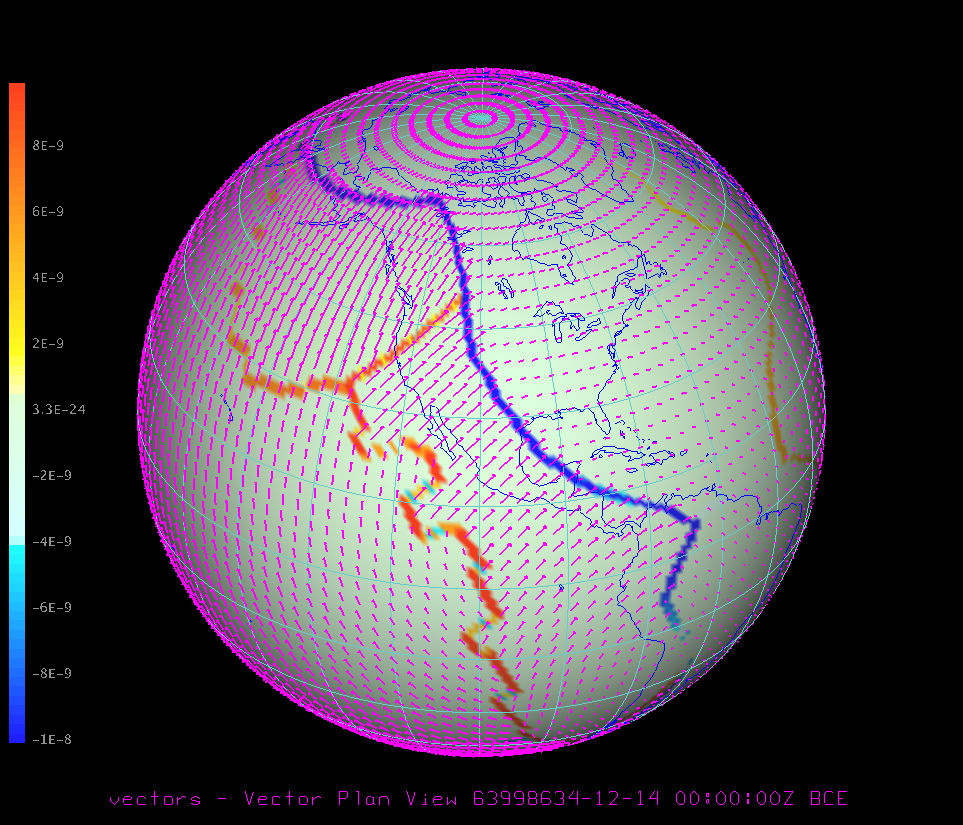
Lithgow-Bertelloni and Richards Plate Velocity vectors and divergence, 64 Ma, North America
Quicktime movie of Lithgow-Bertelloni and Richards Plate Velocity vectors and divergence, 170-10 Ma, North America
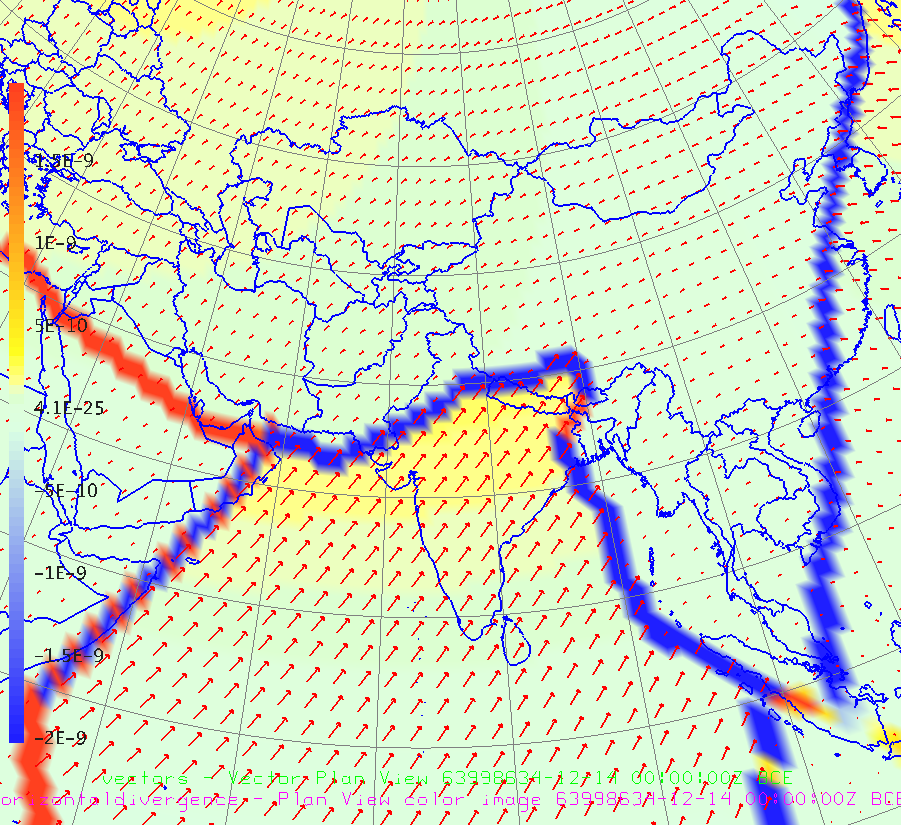
Lithgow-Bertelloni and Richards Plate Velocity vectors and divergence, 64 Ma, India
Quicktime movie of Lithgow-Bertelloni and Richards Plate Velocity vectors and divergence, 170-10 Ma, India
Lithgow-Bertelloni and Richards Plate Velocity vectors and divergence, 170 Ma, 90W
Quicktime movie of Lithgow-Bertelloni and Richards Plate Velocity vectors and divergence, 170-10 Ma, 90 W
Lithgow-Bertelloni and Richards Plate Velocity vectors and divergence, 170 Ma, 30E
Quicktime movie of Lithgow-Bertelloni and Richards Plate Velocity vectors and divergence, 170-10 Ma, 30 East
Lithgow-Bertelloni and Richards Plate Velocity vectors and divergence, 170 Ma, 120E
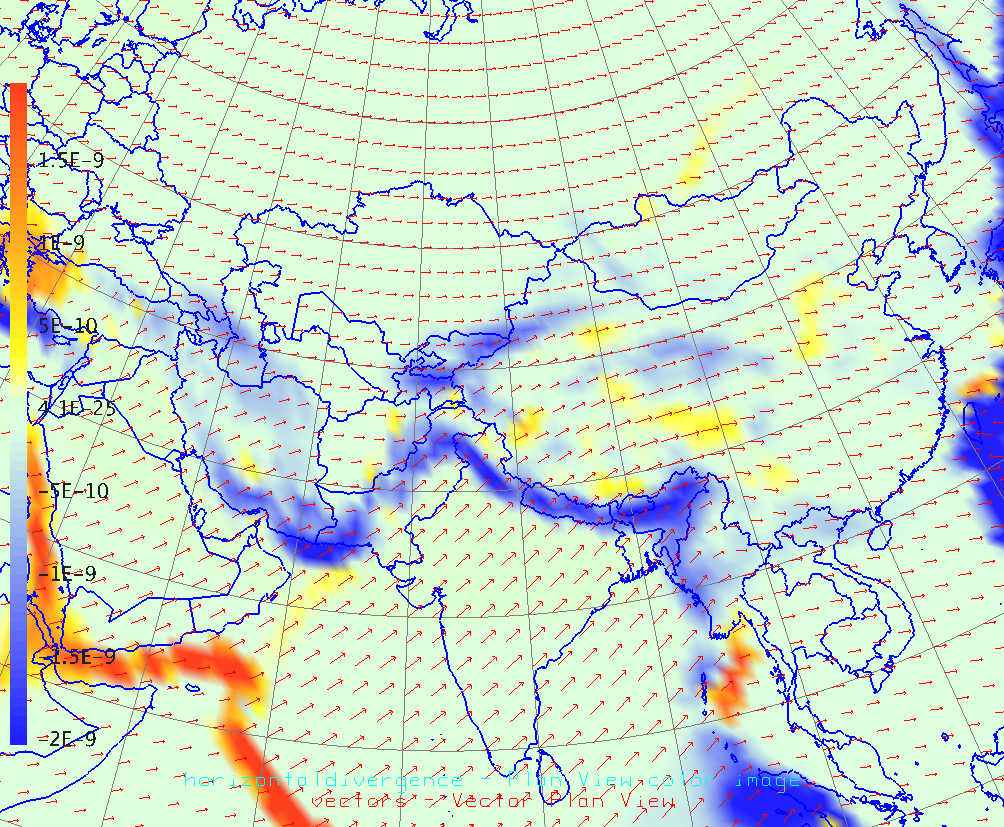
Quicktime movie of Lithgow-Bertelloni and Richards Plate Velocity vectors and divergence, 170-10 Ma, 120 EastLithgow-Bertelloni and Richards Plate velocities and IDV-computed horizontal divergence; Asia, 64 Ma
Computing Plate Divergence from GSRM Velocities and the Lithgow-Bertelloni & Richards Historic Plate Motions
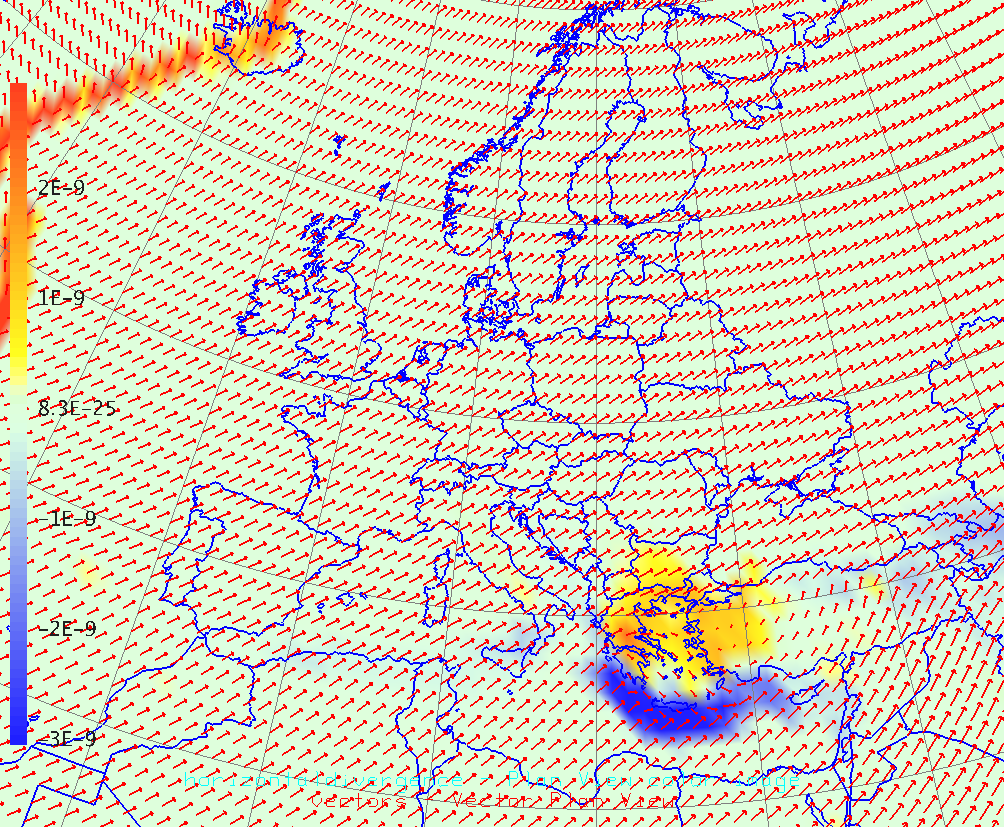
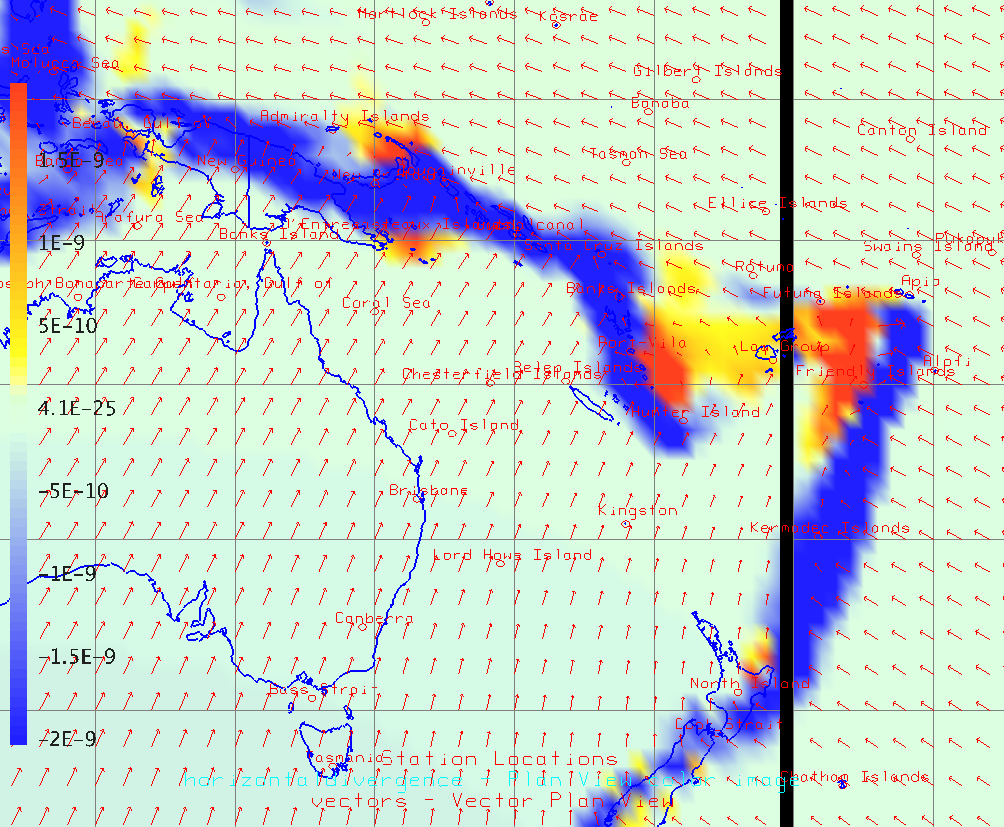
The divergence of a vector field, del dot v, indicates where rigidity (incompressibility) of the plates breaks down -- positive divergence is spreading, negative is subduction or other crustal shortening processes. This is one way to show plate boundaries and their character, and to show intra-plate zones of deformation. Divergence can also indicate where rigidity is violated by expansion or shortening inside what should be a rigid plate.
The IDV includes computations with numerical data sources, ranging from a simple formula to lengthy user-defined computer programs. Many standard calculations are built in. For 2D velocity vector grids you can compute the horizontal divergense For the examples shown here, the computed divergence grid or field is displayed as a image colored by grid values.
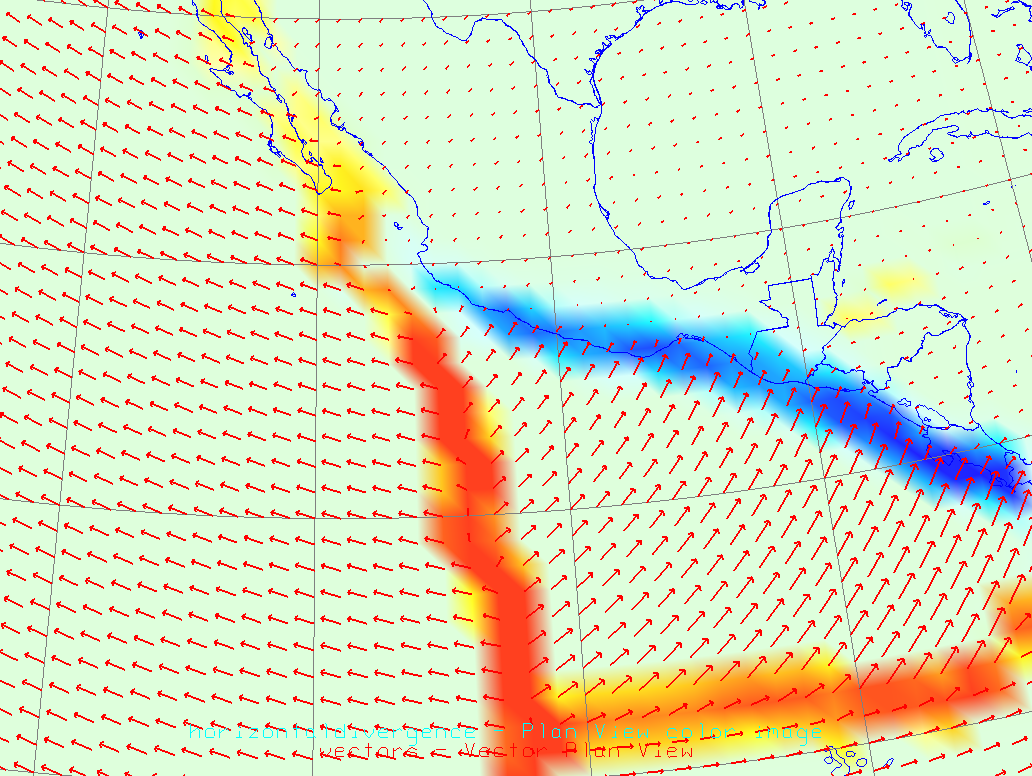
Divergence was computed for the GSRM global velocity field of current plate motions, and the Lithgow-Bertelloni & Richards historic plate motions from 280 Ma to 10 Ma. Some results are shown here. The color scale has red and orange for divergence (spreading centers) and blue for convergence such as subduction zones. Intensity of color indicates speed of convergence or divergence. Inter-plate zones of deformation will also appear.

UNAVCO IDV globe view of horizontal divergence of the GSRM no-net-rotation velocity field, Americas. Red and orange areas are positive divergence (crustal extension or spreading), and blue areas are negative divergence, crustal contraction or subduction . Note that divergence is not the same as the second invariant of strain rate.
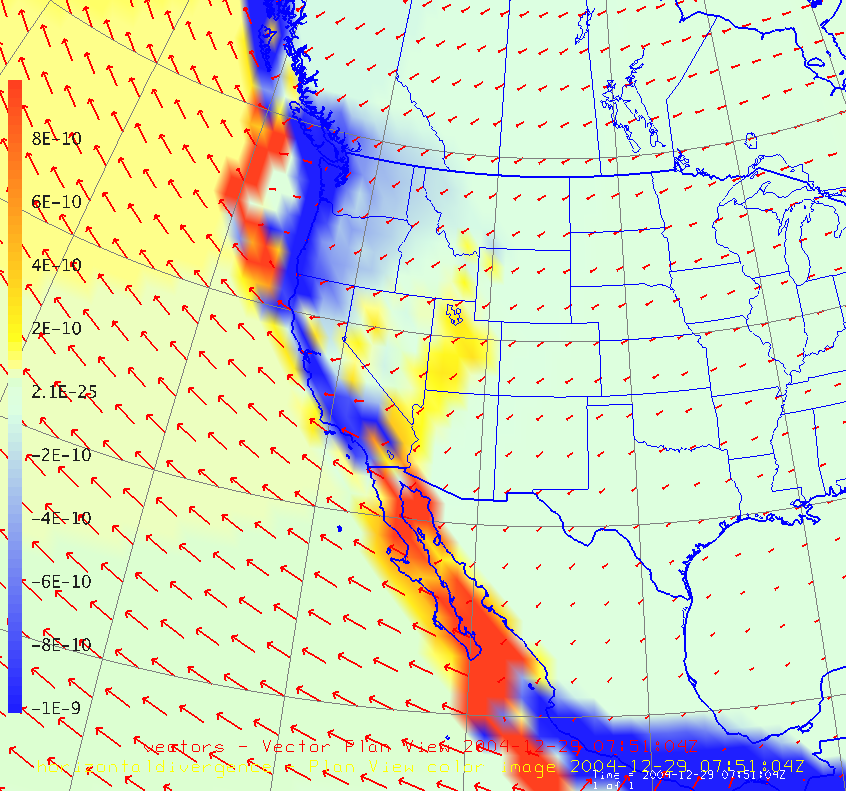
Current Plate velocities from GSRM and IDV-computed horizontal divergence; click for full size
Note the yellow color in the upper left (NE Pacific plate) indicating expansion, not rigidity.
Current Plate velocities from GSRM and IDV-computed horizontal divergence; click for full size
Current Plate velocities from GSRM and IDV-computed horizontal divergence; Europe
Current Plate velocities from GSRM and IDV-computed horizontal divergence; south-western Pacific
Current Plate velocities from GSRM and IDV-computed horizontal divergence; Nasca Plate
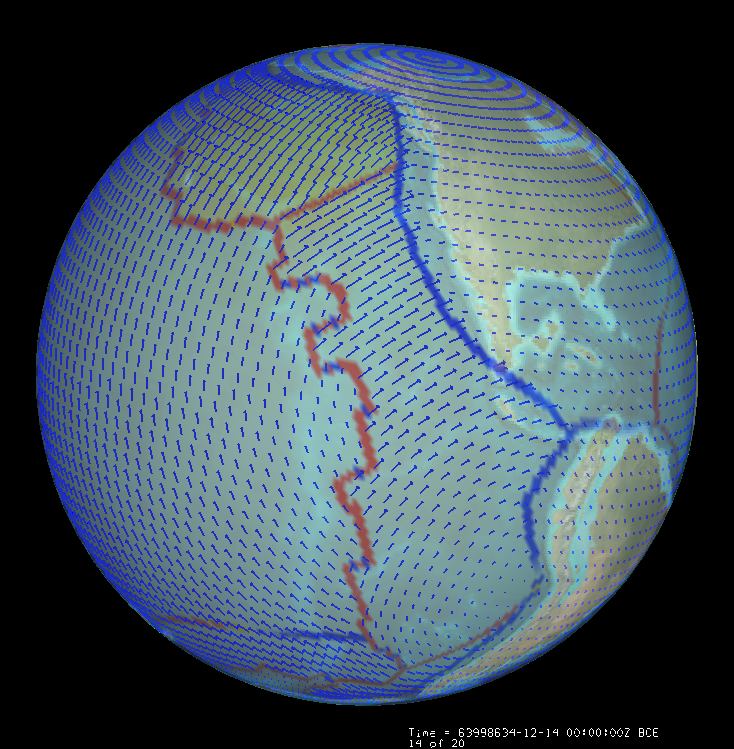
Lithgow-Bertelloni & Richards plate velocity vector field, 64 Ma, IDV-computed divergence of vector field,
and Ron Blakey's (N. Az. Univ.) paleogeographic continental image for 65 Ma.
click for larger, or click here for Quicktime movie for from 280 Ma to 10 Ma, centered on 90 West latitude. L-B_R_Plate_Velocity_vectors_180E_diverg.mov L-B_R_Plate_Velocity_vectors_diverg_90W.mov L-B_R_Plate_Velocity_vectors_90E_diverg.mov
Quicktime movie for from 280 Ma to 10 Ma, centered on 90 East latitude.
Quicktime movie for from 280 Ma to 10 Ma, centered on 180 East latitude.
Quicktime Movie of Lithgow-Bertelloni & Richards plate velocity vector field and IDV-computed divergence, from 280 Ma to 10 Ma, centered on 180 East latitude.
Quicktime Movie of Lithgow-Bertelloni & Richards plate velocity vector field and IDV-computed divergence, from 280 Ma to 10 Ma, centered on 90 East latitude.
Quicktime Movie of Lithgow-Bertelloni & Richards plate velocity vector field and IDV-computed divergence, from 280 Ma to 10 Ma
Plate Motion Quality Checking with the IDV
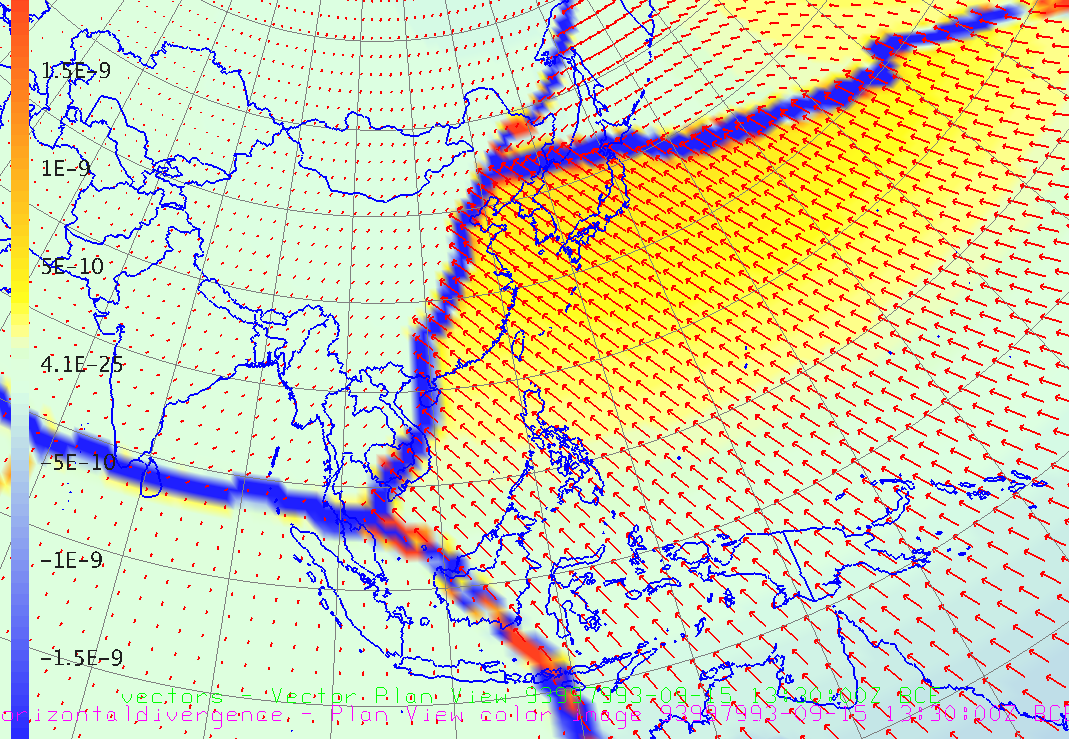
Plate velocities and IDV-computed horizontal divergence; North Pacific, 94 Ma
Data Formats for 2D and 3D Vector Grids in NetCDF for the IDV
Use these files as models of NetCDF file formats for your velocity data. Note you must use the variable names "vn" and "ve" for north positive and east-positive velocity components. Add a new variable "vz" for positive up components; for 3D velocities. (The data is GSRM Plate Motion Vectors (no net rotation) ).NetCDF (binary file) a NetCDF 2D velocity grid for the IDV for one time and one depth: display_images/GSRM_velocity_NNR_with_time.nc
CDL (ASCII file):
display_images/GSRM_velocity_NNR_with_time.cdlFor more details, see NetCDF Data for the UNAVCO IDV .
 Lithgow-Bertelloni and Richards Plate Velocity vectors and divergence, 64 Ma, North America
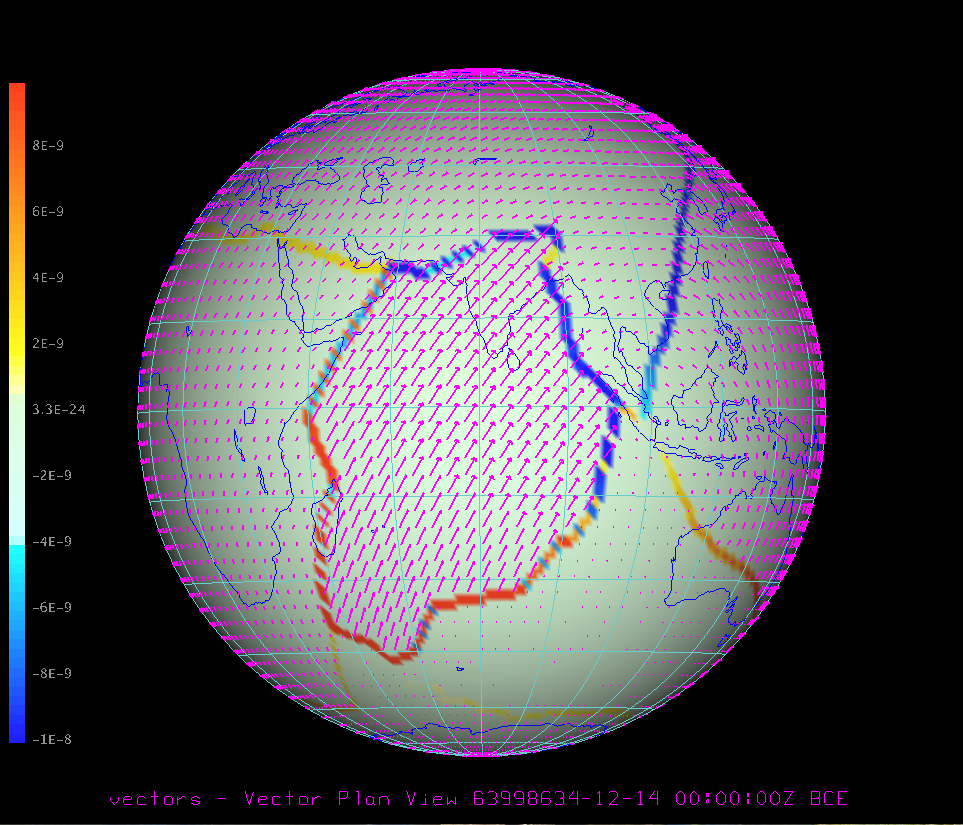 Lithgow-Bertelloni and Richards Plate Velocity vectors and divergence, 64 Ma, India
 Lithgow-Bertelloni and Richards Plate Velocity vectors and divergence, 170 Ma, 90W
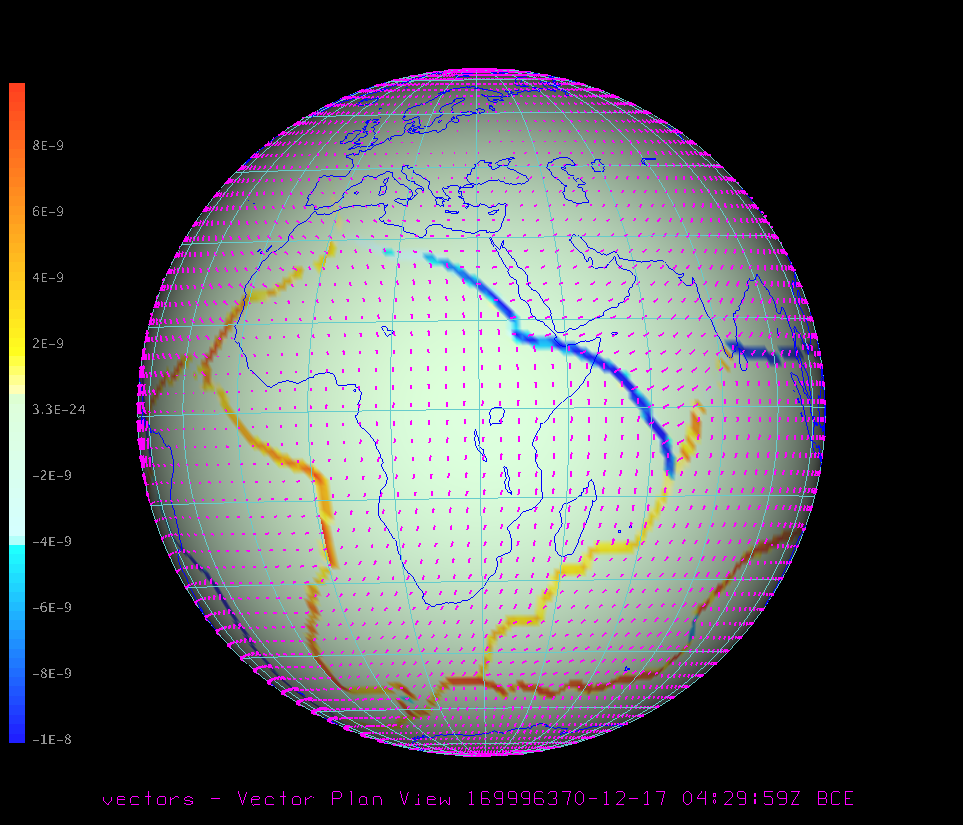 Lithgow-Bertelloni and Richards Plate Velocity vectors and divergence, 170 Ma, 30E
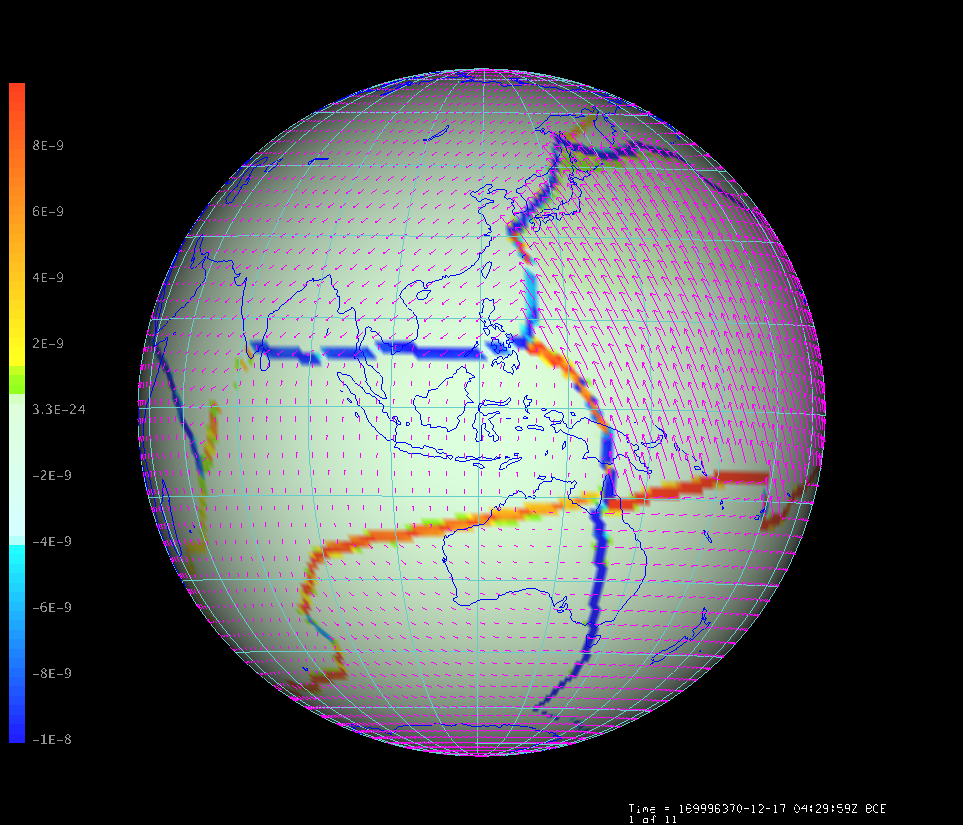 Lithgow-Bertelloni and Richards Plate Velocity vectors and divergence, 170 Ma, 120E