UNAVCO IDV and Track Data
UNAVCO IDV and Track Data
The IDV can plot tracks of ships, buoys, aircraft and any other sensor with a position time history.
Tracks can be combined with displays of parameters fields, such a air temperature, topography displays, such as contours or 3D relief maps, and point data
values.
Track or path data is a sequence of points in latitude, longitude, and time,
on, above, or below the earth or ocean surface,
with, optionally, observed
data values at each point. The IDV can display the track as a
sequence of point symbols which you may animate in time, or as a continuous line.
The data values also can be seen in a table.
You can change the point size or symbol, or line thickness, and color scheme with IDV controls.
Track displays in the IDV can be colored by measured data values
along the path.
There are two NetCDF formats and one ASCII format described on this web page for any track.
IDV Text Point Data Format Files - the simplest Track Format
Aircraft Track Data (3D paths above the surface)
Vertical Soundings (3D paths below the surface)
Animal Track Data (Mapped tracks on the surface, including 3D topography surfaces)
IDV Text Point Data Format Files - the simplest Track Format
This simple ASCII format may be used for any track purpose, including land and sea surface tracks, and paths
above or below the surface from aircraft to seismic ray paths. It can also be used for vertical boreholes and
soundings.
Here is a sample IDV ASCII track data file.
It is a comma separated value (csv) file, with one line per data location and time (point observation).
You can use it as a template for your own data. The particular data in the file simulates tracking a bear at 18
locations and times in Colorado.
The top two lines are IDV-specific header for this one case (time and lat-long-altitude location, plus a single kind of parameter or measured value at that point).
The example csv data file has five columns (Time, Latitude, Longitude, Altitude, and sensor_1 values) in each row.
For tracks, keep the
first four column types as they are; you may rename the "sensor_1_values" item, and add more sensor values types in the second header line, such as adding
water_temp[unit="celsius"]
. Altitude is
optional, or can be all 0s for example, but time, latitude and longitude
are not. If you want to display the data in a 3D display at precisely the correct level, use altitude
even if all values of altitude are the same.
Negative altitude values are below sea level (O.0 in the IDV vertical scale).
The sensor values are any kind of observed data value at each location and time. Sensor units can be "null."
Unit names should be standard international unit specifications (udunits compatible). A list of valid names can be found at
http://www.unidata.ucar.edu/software/udunits/udunits-1/udunits.txt.
Read more details about
Text (ASCII) Point Data Format from the UNAVCO IDV help
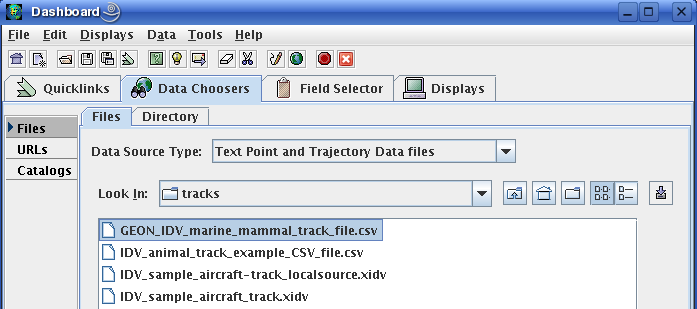
When
you load a data source like this in the IDV Dashboard's Data Chooser,
select "Data Source Type" of "Text Point Data Files " (not "Track files"
which is for NetCDF formatted track files).
These tracks can be displayed with "accumulating time animation" showing the progress along the track with time.
Sample IDV displays of track data:
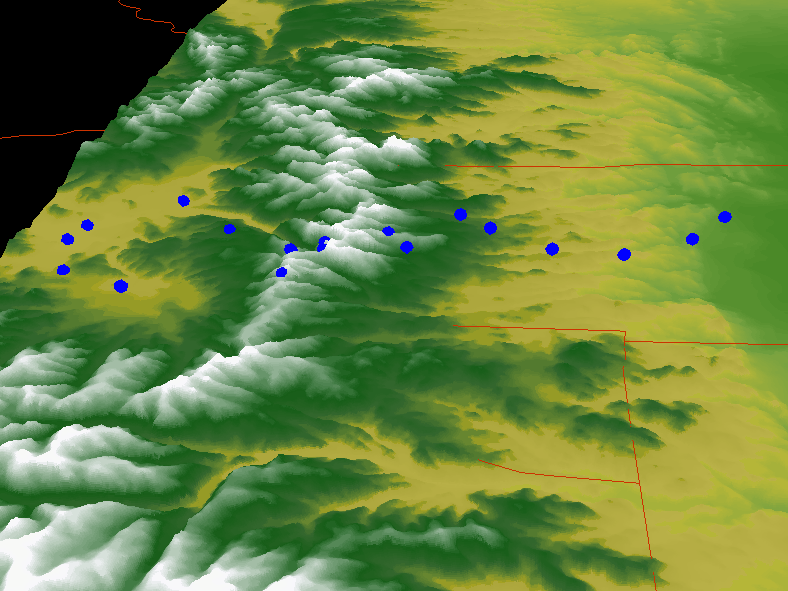
3D oblique view of track, with 3D topographic relief using USGS DEM files (topography data). The region is the Colorado Rockies with county lines in red.
Click for full size
IDV movie in 3D oblique view, with 3D topographic relief (animated gif file; 8 MB).
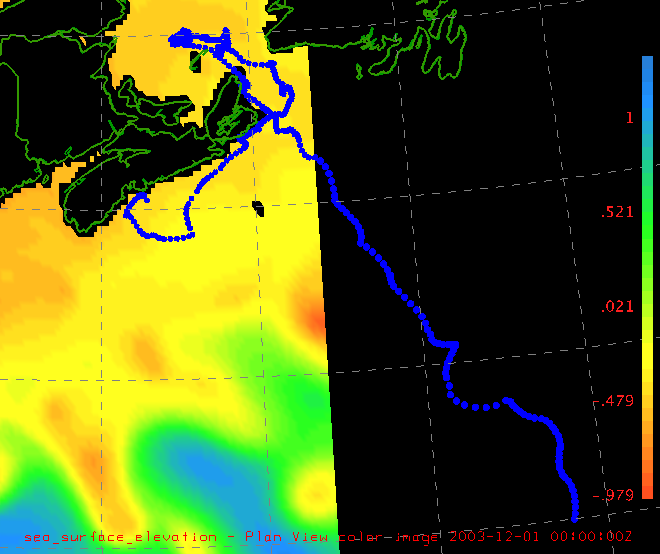
Sea turtle track (positions as points or dots, animated by time) with 2d sea surface elevation data (data provided by Maswood Hasan Mostafi, Dalhousie University).
Click for larger image.
IDV movie of sea turtle track on SST (4 MB).
Alternately, you can show a track as a continuous line, optionally colored by data value at each point.
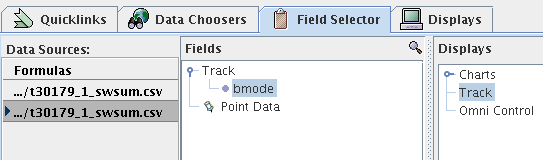
For the line, use the Data Chooser
"Data Source Type" "Text Point and Trajectory Data Files:"
In the choice of Dashboard's Field Selector panel,
click the parameter to control the color (named bmode here), and choose
Displays type "Track:"
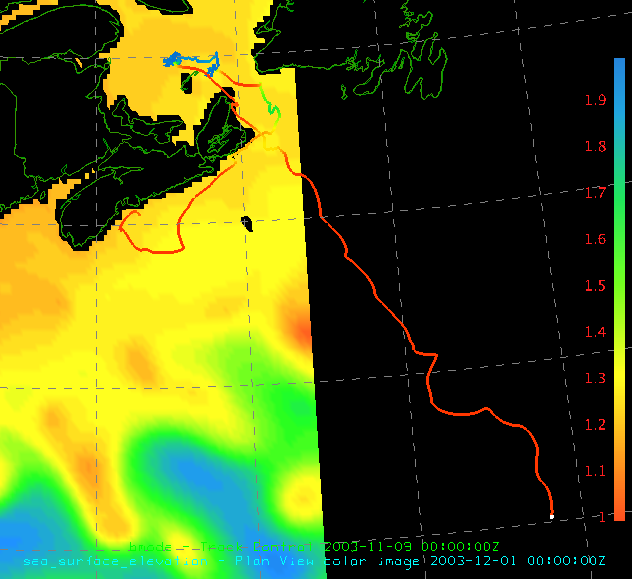
Sea turtle path, colored by observed parameter value (different from the background SST) along track. Click for larger size.
More than one color scale may be shown in a display.
Marine track data provided by Maswood Hasan Mostafi, Dalhousie University. Displays by UNAVCO.
Aircraft Track Data
This section shows sample IDV data for aircraft track data, or any 3D path above or below the surface.
The data is IDV NetCDF Point Data format.
The data is synthetic, not real.
This data format makes a separate point symbol for each location,
optionally with color by data observation value (if any obs provided).
Each data file is for one track., and specifies a series of (latitude, longitude, altitude and time) locations.
One data file may have zero, one or many types of observed variables in each file, each type with one value for
each location. The example has only one observed data type, called "sensor_1_values."
Aircraft Track sample data file for the IDV (IDV NetCDF Point Data):
display_images/IDV_sample_aircraft_track_data.nc
This URL is an IDV "data source;" you can enter this URL link location into the IDV Data Choosers URLs window.
To learn about NetCDF data files, see
NetCDF data files for the IDV.
Matching CDL ascii file for the NetCDF Point Data file:
display_images/IDV_sample_aircraft_track_data.cdl
Use this to see how the file is formatted.
In this sample file all data values are each on one line. One or more data values may all be on a line.
Sample IDV Displays:
This data type can be displayed with "accumulating time animation" showing the progress along the track with time.
These sample images show all the times in the sample data set.
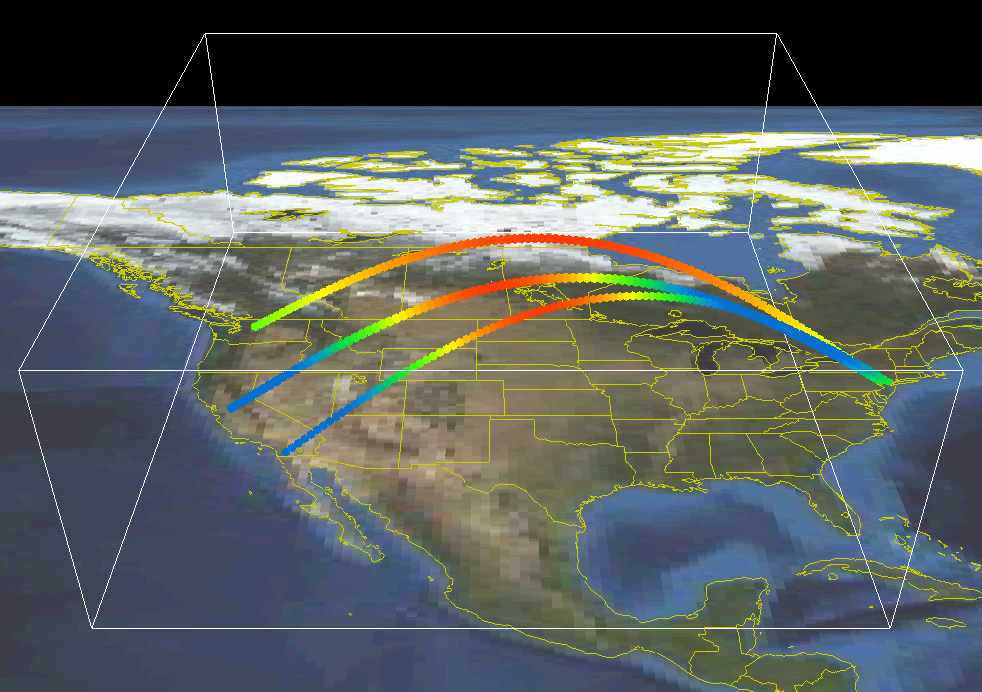
3D oblique view of aircraft tracks,
with observations colored by value (synthetic data).
Wireframe box is 18,000 meters high. Click for full size
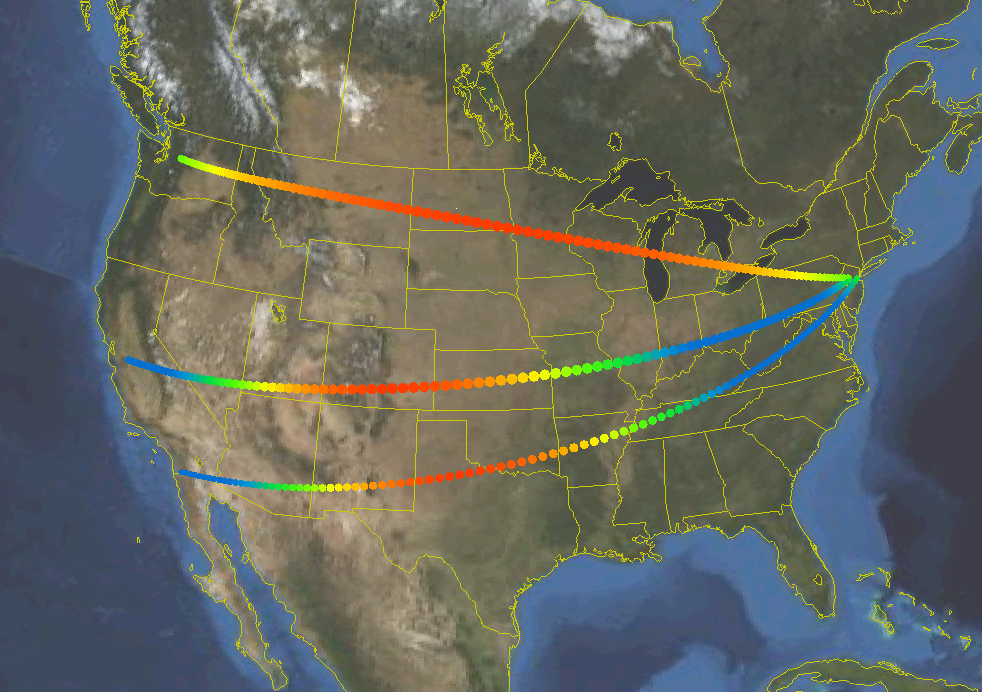
map view of same data.
Three aircraft tracks over the U.S. (synthetic data), colored by value
of observed parameter, with NAM numerical weather forecast
model output temperature contours at 300 and 600 mb
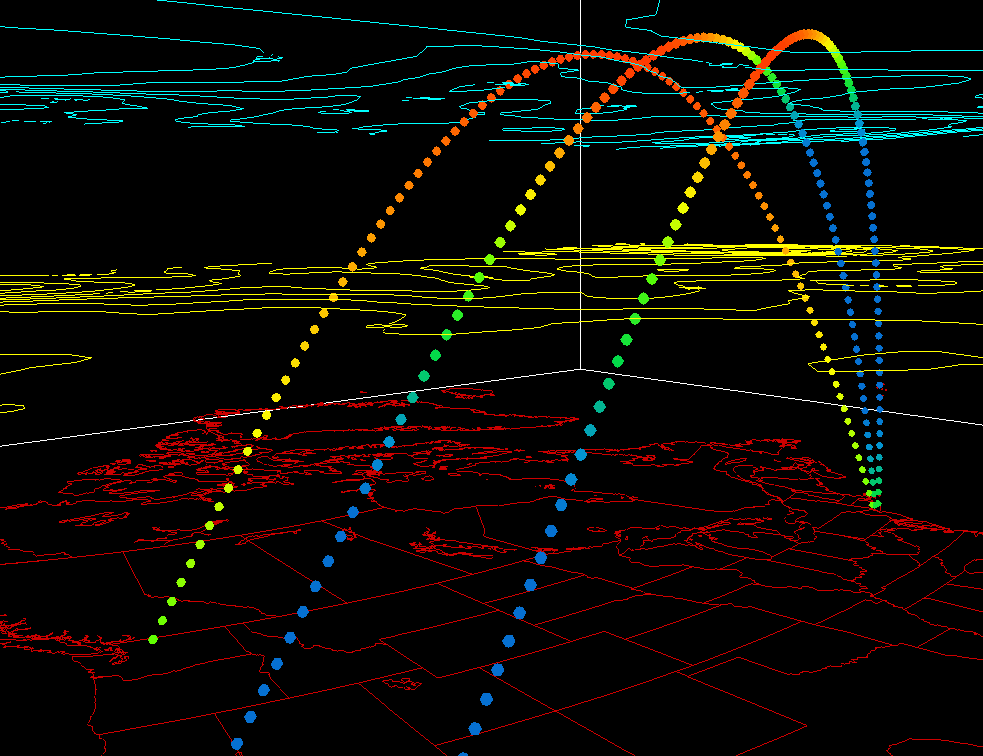
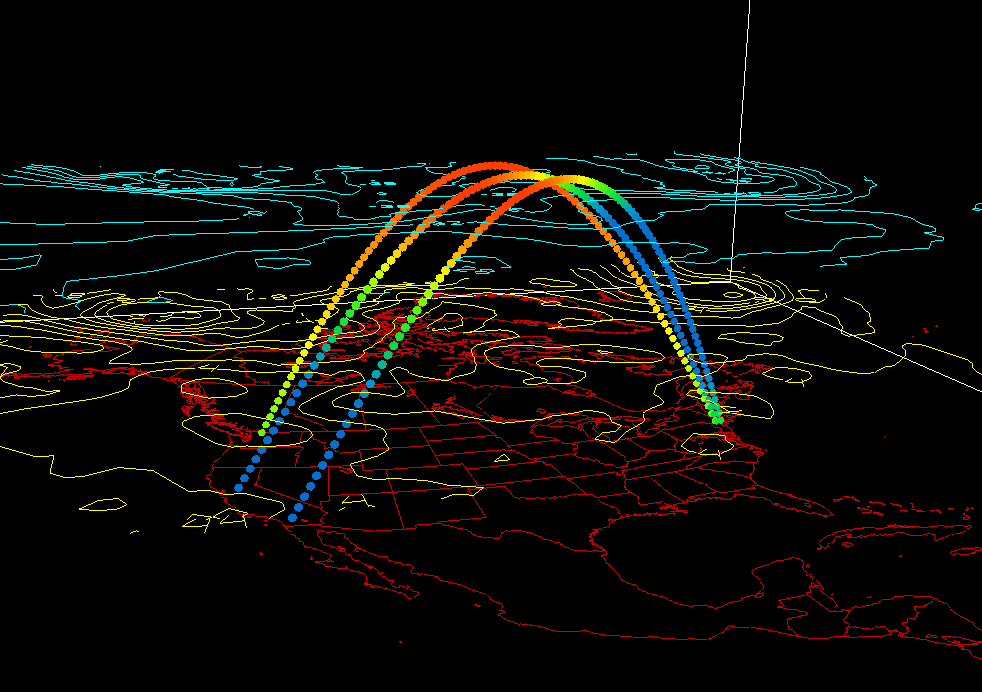
Zoomed view of the same thing
Vertical Soundings (3D paths below the surface)
This vertical sounding data example may followed as a template
for borehole logs, oceanographic soundings, or any
measurements along a path in 3D below (or above) the surface. The path can be curved.
The path can be colored by measured values along the path.
More than one parameter may be measured and stored in the data file. Any of the parameters can be used to
color the path. Individual parameters' values at points along the path are shown in a table.
The NetCDF format used here is an IDV 3D path file format. The NetCDF binary file ends in "p3.nc" That tells the
IDV how to plot the data.
Sample files for the IDV
Sample IDV Displays
There are 487 data points in this path.
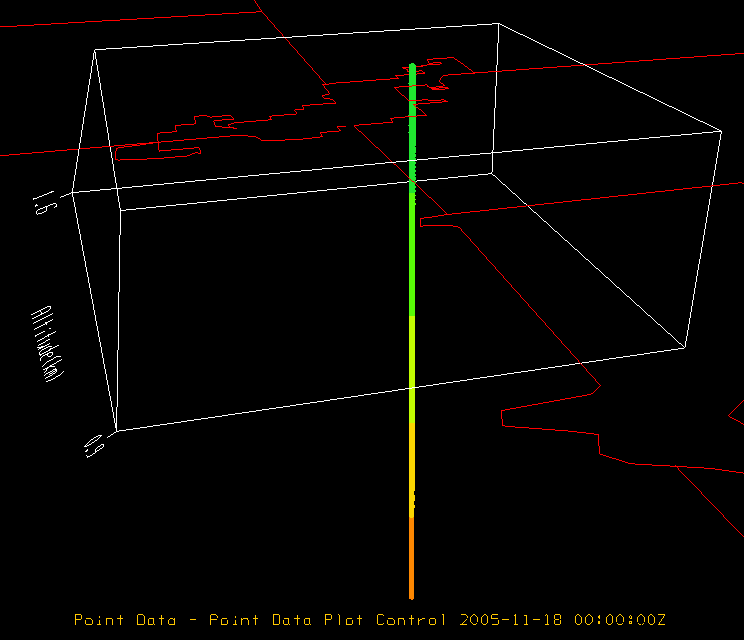
Synthetic borehole under Broomfield, Colorado, colored by P wave velocity, in oblique 3D display.
Click for full size
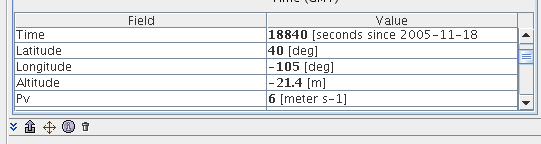
IDV readout of point values along the track
Animal Track Data -- Mapped tracks on the surface, including on 3D topography relief surfaces
This section shows a sample IDV data file for animal track data. The data is synthetic, not real.
The data is IDV NetCDF Point Data. This is the same format as the aircraft data described above.
This data format makes a separate point symbol for each location plus data observation value (if any obs provided).
One data file may have many types of observed variable. The example has only one, "sensor_1_values."
Animal track sample data file for the IDV (IDV NetCDF Point Data):
display_images/IDV_sample_track_data_for_animal.nc
This URL is an IDV "data source;" you can enter this URL link location into the IDV Data Choosers URLs window.
To learn about NetCDF data files, see
NetCDF data files for the IDV.
Matching CDL ascii file for the NetCDF Point Data file:
display_images/IDV_sample_track_data_for_animal.cdl
Use this to see how the file is formatted.
Sample IDV Displays:
These displays also used USGS DEM topography data to make 3D relief topography in the IDV.
The tracks can be displayed with "accumulating time animation" showing the progress along the track with time.
