UNAVCO IDV: Magnetic Anomalies Displays and Data Sources
UNAVCO IDV: Magnetic Anomalies Displays and Data Sources
Magnetic anomly data, like all gridded or point data can be displayed in the IDV as contours, color images, and drapped over topography, or depicted as a relief of its own value, and displayed with other Earth-located data, employing all of the IDV's full interactive and mapping capabilities.
Here are some examples.
Magnetic anomalies or observations in latitude-longitude grids in NetCDF format can be used by the IDV.
Both scalar values and vectors can be shown in the IDV.
See the information in this web site about data vector data formats (The IDV uses vector component parameter names vn and ve).
A excellent source of U.S. potential field values is
PACES.
The data can be obtained from the
PACES Magnetic database.
Here is a file of
PACES magnetic anomaly observations for Wyoming made into a NetCDF format file for the IDV. The grid spacing is 0.77 km.
Here is the equivalent NetCDF CDL file in ASCII to show a suitable NetCDF
file format for this kind of data.
Gridding PACES with GMT for IDV Use
PACES data is at point locations, not gridded.
You can use GMT to grid PACES gravity for the IDV,
as these examples show. Here is some help
to start with. Gridding is not fool-proof; you can shift
feature locations slightly depending on how you do it, so take care.
The grided sample files of PACES data by UNAVCO is only for illustrating the process and NetCDF data formats.
Do not rely on the accuracy of these gridded anomalies for actual field use.
IDV Display of magnetic anomalies
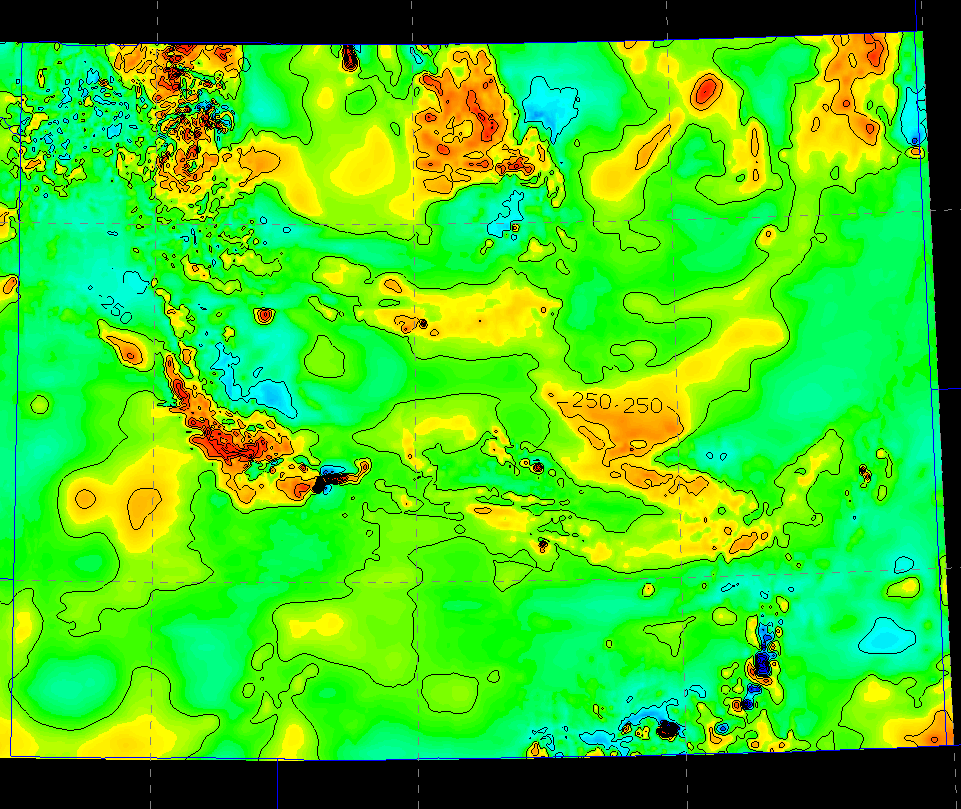
IDV Display of Wyoming magnetic anomaly, nanoTeslas.
Click for larger image
And, CHECK OUT THESE DATA:
NOAA'S NGDC Gridded Data - Regional and Global Data Sets.
UNAVCO-made data displays Copyright © 2004-2012 UNAVCO Inc. Reproduction or reuse for commercial purposes
or promotion prohibited without prior written permission from UNAVCO.